This research explores the risk that the Three Gorges dam will experience failure.
I believe the risk that the dam becomes structurally compromised, and requires the government to drain the reservoir to undertake repairs, is 20-25%. In the case that there is a seismic event, that likelihood would be closer to 80%. I put the chance of a dam failure during this summer’s ongoing floods at 5-10%, rising to 30% in the case of a seismic event.
Introduction
Did Wuhan commit a great crime in 2019? How else to explain the city’s bad luck in 2020, beginning with the COVID-19 world pandemic and continuing with recent worries that the Three Gorges Dam (TGD), the world’s largest, might burst and flood the city? News reports about the dam have primarily been journalists repeating the opinions of various experts, with some quotes dating back to the 1990s. Predictably, this has encouraged the formation of two camps: those primed towards conspiratorial speculation that the Chinese Communist Party is lying about a looming catastrophe, and those that repeat state media lines that rumors about the dam are the work of China’s foreign enemies.
Nonetheless, I think that clear thinking about risk can help us assess the likelihood of disaster at the TGD. The dam is subject to three types of risks:
structural integrity risk, which originates in the dam’s construction and maintenance
foundation risk, which reflects the geologic stability of the dam’s foundation
shock risk, which the likelihood that an external shock occurs, like an earthquake or landslide.
Structural integrity risk is hard to assess, but we can obtain relatively clear information to assess foundation and shock risk, if we make use of valuable geologic data gathered by the Three Gorges Development Corporation in the 1990s. Moreover, the changing rhetoric of press releases from the Chinese government can reveal how the authorities themselves, who have live access to the state of the dam, are mitigating these risks. The government’s behavior can then further calibrate our sense of how large and realized these risks actually are.
I have been unable to come by reliable information to assess the structural integrity of the dam. The major risk to the dam comes from foundation risk. As can be ascertained from geologic data, Sections 1-5 of the left powerhouse lie on top of a low-dipping joints with high connectivity, meaning that there is elevated sliding risk. The dam’s recent deformation on July 21 means previously calculated safety ratios are likely inflated. Moreover, changes in government rhetoric support this suspicion. In contrast to years past, the government claims that the dam was never mean to control floods and that each region should figure out their own solution.
In terms of shock risk, the dam is susceptible to seismic activity, instability arising from the sheer weight of the TGD reservoir, and flood waves large enough to overwhelm the dam’s sluice gates. As of writing (July 26), the 3rd flood wave has officially formed in the Yangtze, and a 4th might appear in short succession. Overall, I think there is a 20-25% chance that the dam is further structurally impaired, prompting the government to continue draining the reservoir as fast as possible. There is something like a 5-10% chance that multiple flood waves overwhelm the dam and raise the reservoir level. These would weaken the dam or its foundation and cause a sliding failure. Were an earthquake to happen this month, these risks would be something more like 80% and 30%.
Anatomy of a dam
There are several types of dam design: arch dams, buttress dams, embankment dams, and gravity dams.
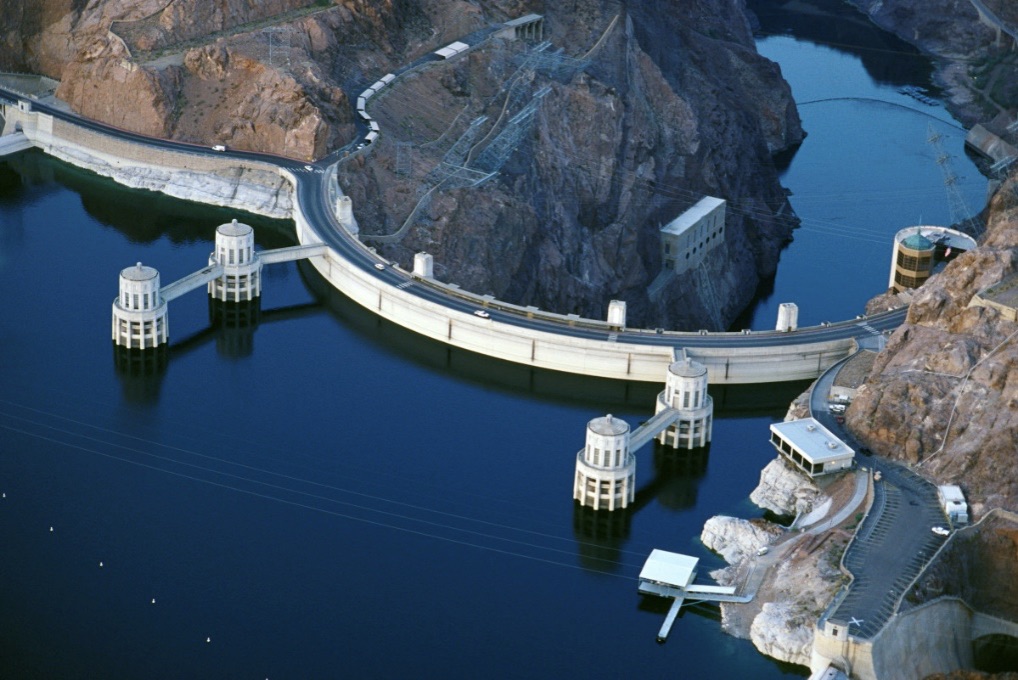
Arch dams hold back the water partially through the strength of their structural shape. The Hoover Dam is an example of an arch dam. The arch is convex facing upstream, which distributes water pressure along the structure to the abutments at each end.
The Hoover Dam, Arizona-Nevada border
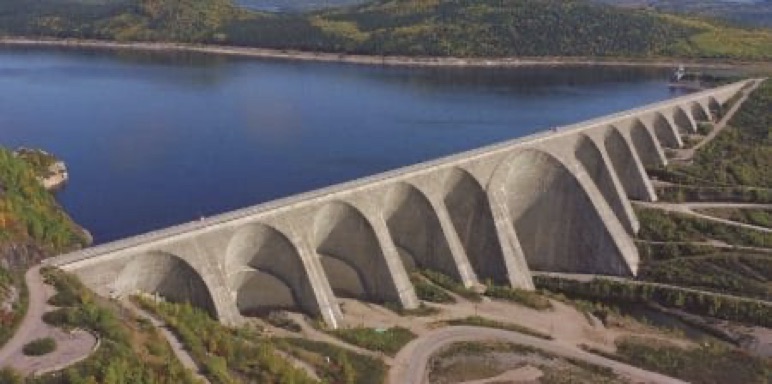
Buttress dams consist of a face slab which angles away from the upstream, and is supported on the downstream side by buttress structures. These structures are attached to a base slab foundation. Buttress dams are built in areas with looser soil foundations.
The Daniel-Johnson Buttress Dam, Canada
Embankment dams are built up by the piling up of soil, rocks, or synthetic materials. These are usually porous on their outside but have an impervious core. Their main advantage is their low cost and flexibility, which allows them to adjust to shifts in the embankment or settlement of the foundation over time.
Gravity dams resist water flow through their sheer weight, which pulls them vertically down and allows them to resist the horizontal force of water pressure along their surface. This is similar to what a child does when he blocks a stream or rivulet by piling rocks—they divert the water flow not through any structural design but through their weight. This is the origin of the name “gravity dam.”
A U.S. Department of the Interior report in 1998 explored various dam “events”. These include four gravity dams in the United States and one in France1. All five suffered damage due to sliding, and two of them failed entirely. The remaining three required additional drainage, reinforcements, and the release of reservoir waters to keep water depths low. For example, the Morris Shepherd Dam suffered sliding because the initial loading of the reservoir changed the stability of the bedrock foundation such that the safety ratio fell below 1.0. In other words, the load that the dam could support before failing had fallen below the regular load the dam was supposed to hold.
Foundation risk is sliding risk
The most important factor in sliding events is the nature of the bedrock on which a gravity dam is built. In failures of this type, the part of the foundation on which the dam rests slides downstream. We have reliable data to study this phenomenon, though media and news commentators have not put in the work.
In 2003 scientists from the Chinese Academy of Sciences and the Yangtze River Scientific Research Institute received data and support from the Three Gorges Development Corporation, the Changjiang Water Resources Commission, and the Chinese Academy of Sciences to conduct a stability assessment of the dam’s foundation using physical and numerical modeling.2
The study incorporated a variety of techniques for the stability assessment, including conventional methods of geological mapping such as borehole drilling and shaft exploration, geophysical prospecting such as acoustic emission, remote sensing, seismic reflection and refraction, electromagnetic techniques, and physical-chemical analysis and micro-structural analysis. Most of these data are recorded in expensive studies commissioned in 1998 and 1999, when the dam was being built.3
They conclude that the “major factor influencing the foundation stability would come from the pre-existing discontinuities. However, among these discontinuities the faults mostly have steep dip angles, thin thickness, and well-cemented tectonite, so they would not play important roles in the foundation stability.”
Foundation, faults, and joints
The foundation is plagioclase granite which is homogenous and of high strength, and with various degrees of weathering, though the dam itself is on the moderately and lightly weathered parts.
The are 886 faults in the granite, most of which have steep angles (i.e. they go down more than sideways). 90% of these are shorter than 300 meters and narrower than 1 meter. Most of the faults are filled in with tectonite, a metamorphic type of rock.
The granite also has a very large number of joints. Joints are fractures where the two sides, unlike in a fault, lack visible or detectable movement relative to each other. 13% of joints have dip angles less than 30 degrees, 10% are between 30-60, and 77% are greater than 60 degrees.
The low-dipping joints have been studied more than the others because they dip downstream at an angle low enough to create sliding surfaces in the dam’s foundation. This was determined to be the greatest risk to foundation stability.
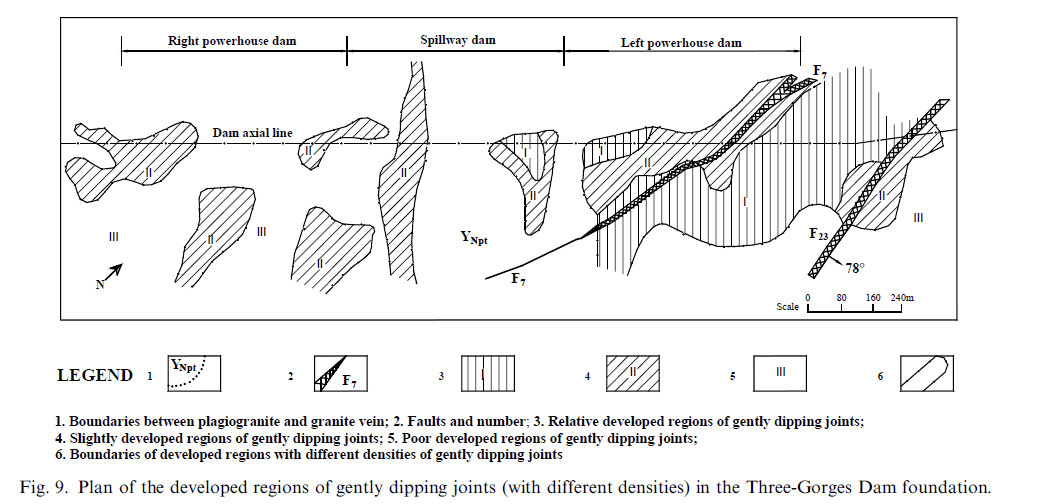
As we can see in the illustration below, the area of greatest risk is labeled “relative developed regions of gently dipping joints,” which is where these low dipping joints are present in both long and short form, and in high densities. This area crosses the dam around the left powerhouse, which also overlaps with one of the large faults.
Rock joint distribution along the foundation of Three Gorges Dam (Liu et al)
Another risk factor is connectivity: the percentage of joints that could form a potential sliding path. The higher the connectivity, the higher the probability that a disturbance will link the joints into a fracture that produces a sliding event.
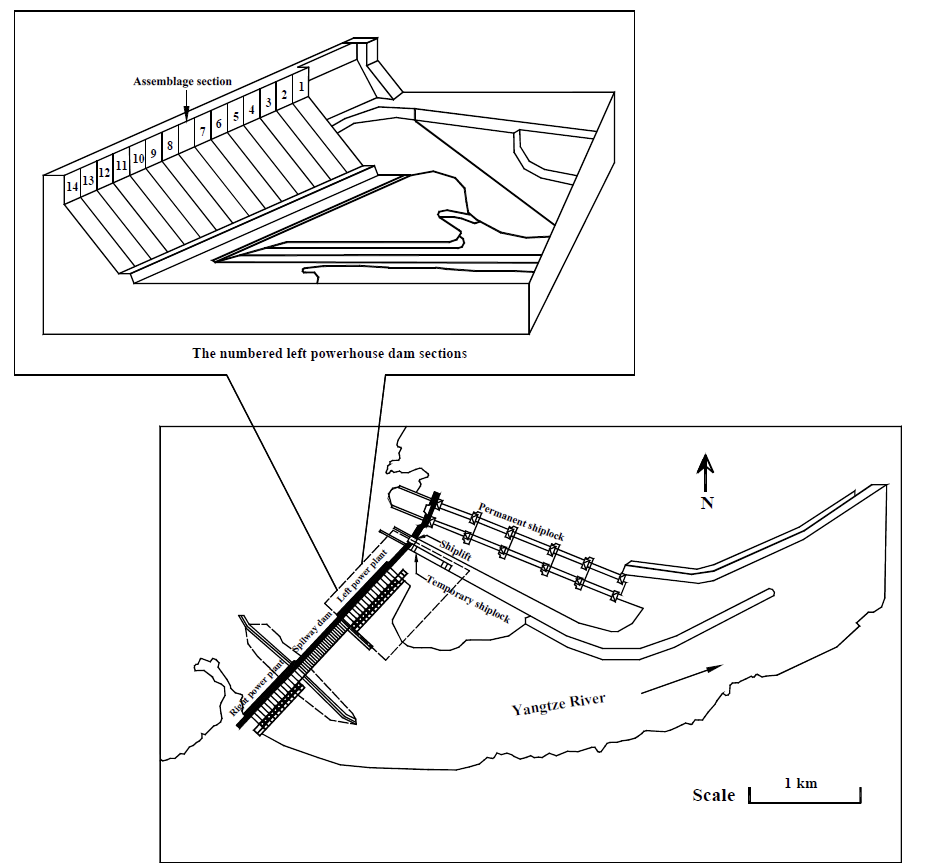
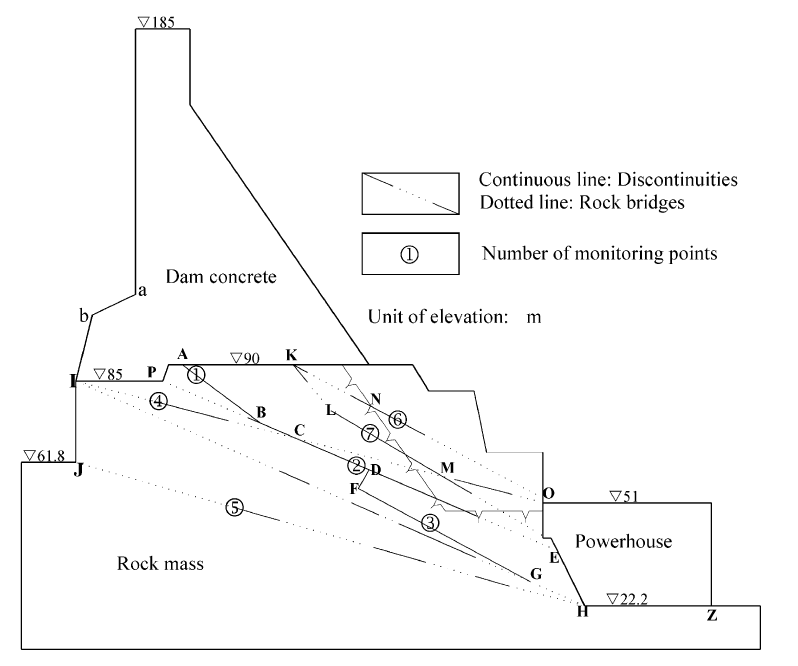
Layout of the TGD and the numbered left powerhouse-dam sections (Liu et al)
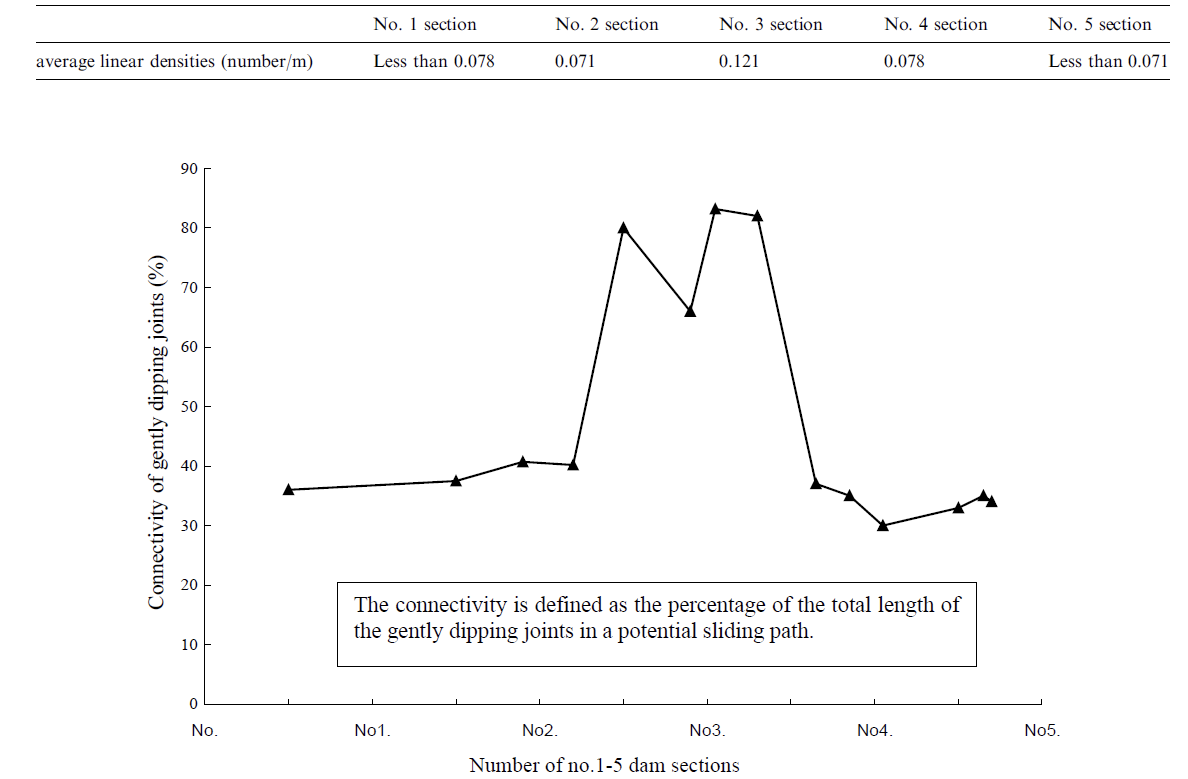
Sections 1-5 of the left powerhouse dam are the weakest links. As can be seen below, the density of low-dipping joints is highest under Section No. 3 of the left powerhouse dam. Even more unfortunately, Section No. 3 also has the highest joint connectivity—80% of the joints are in a potential sliding path!
Avg. linear density of low-dipping joints, and connectivity, for Sections No. 1-5 (Liu et al)
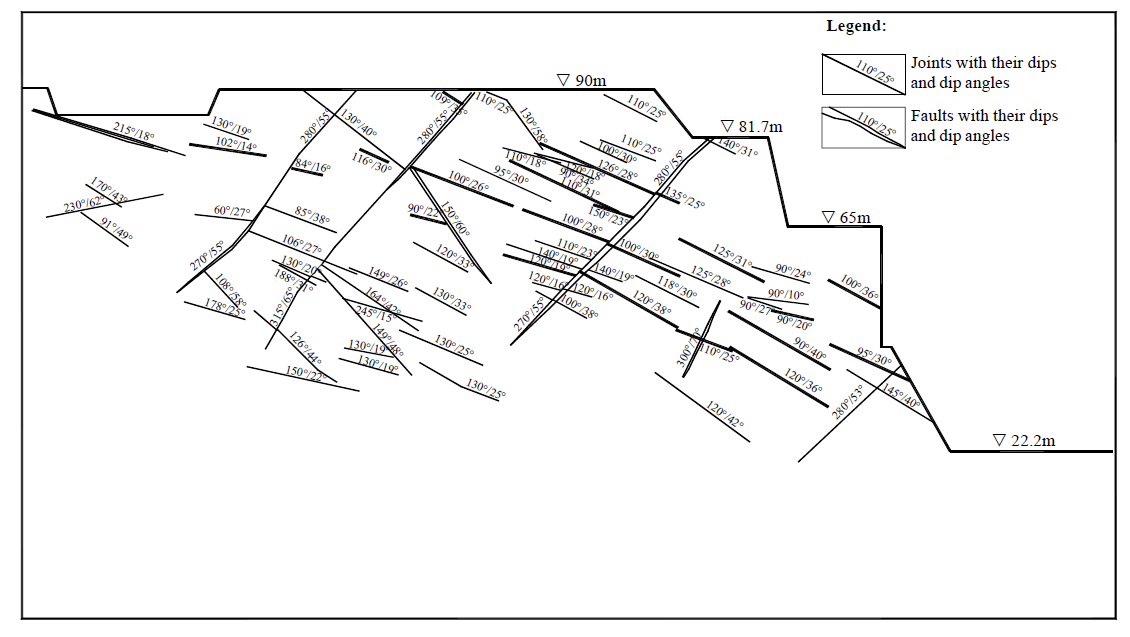
We can appreciate the high connectivity of the joints under Section No. 3 through the geological sketches from Liu et al.
Geological sketch of the foundation of Section No. 3, with joints and their angles (Liu et al.)
What is the dam’s official safety ratio?
The Chinese Design Criterion of Concrete Gravity Dams sets the safety factor against sliding at 3.0. This means that the dam should be able to support three times its standard load. To determine the TGD’s safety factors, the scientists physically and numerically modelled the various potential sliding paths of Sections 2-4.
Geological model of Section No. 3 of the left powerhouse-dam (Liu et al.)
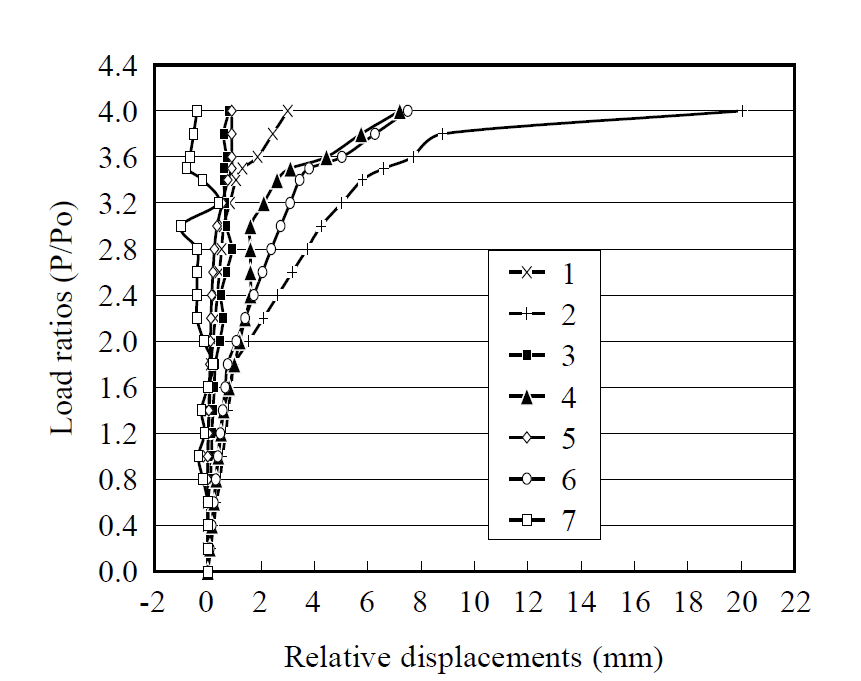
These models were then put under strain. The various joints and points were measured for displacement. An accelerating rate of displacement indicates that failure is imminent. As we can see from the Section 3 displacement curves below, failure is almost certain after the second inflection point of 3.2, however, the dam starts to become unstable at load ratios above the first inflection point of 1.8.
Load ratio and relative displacement curves from physical model test (Liu et al.)
The dam’s safety ratio may be inflated.
Remember that the load on a dam retaining wall does not increase linearly. Hydrostatic pressure at a certain point \(P\) is equal to \( \rho gh \) - the product of the density of water, the gravitational constant, and the water depth.4 So the resultant force per meter of dam then is simply the integral over \( P = gh \), which is \(\frac{gh^2}{2}\). In other words, the force that must be contained by the dam increases quadratically with the depth of the water.
The dam is built to maintain a water level of 145m, with a designed maximum capacity of 175m. The dam has a total height of 185m. According to the physical models, the 1.8 load ratio at which displacement occurs would happen when the water reaches a height of 194m, about 10 meters over the dam’s height of 185m. The water should overflow the dam before causing any damage.
However, on July 21, Chinese authorities confirmed that, in contrast to earlier claims, the dam had experienced significant deformation and movement, though I have no images or way to determine which section of the dam was affected.5 The Asia Times reported: “The company noted that parts of the dam had “deformed slightly,” displacing some external structures, and seepage into the main outlet walls had also been reported throughout the 18 hours on Saturday and Sunday when water was discharged though its outlets.”
However, we know waters have been at 161m. This implies that the load ratio at which displacement is significant is not 1.8, but rather 1.23.
Though we are not sure how to properly adjust the displacement curves obtained through modeling, a proportional flattening of the displacement curves would suggest that the load ratio at which failure would certainly happen is 68% of 3.2, or 2.18. This implies a failure water depth of 214m, not the 259m implied by the safety ratio. For reference, the load ratio of the dam when filled to the top height of 185m versus the flood maximum of 145m is 1.63.
The Chinese researchers have noted that these modelled safety ratios are best case scenarios, because it does not take into account the true extent of the geological and mechanical properties of the rock foundation, and more importantly, the changes brought about by the massive weight held up by the Three Gorges Reservoir.
In short, this means that the Three Gorges dam could very well be in the uncomfortable space between the first and second inflection points on the previously calculated displacement curves, so the risk of sliding failure is above zero.
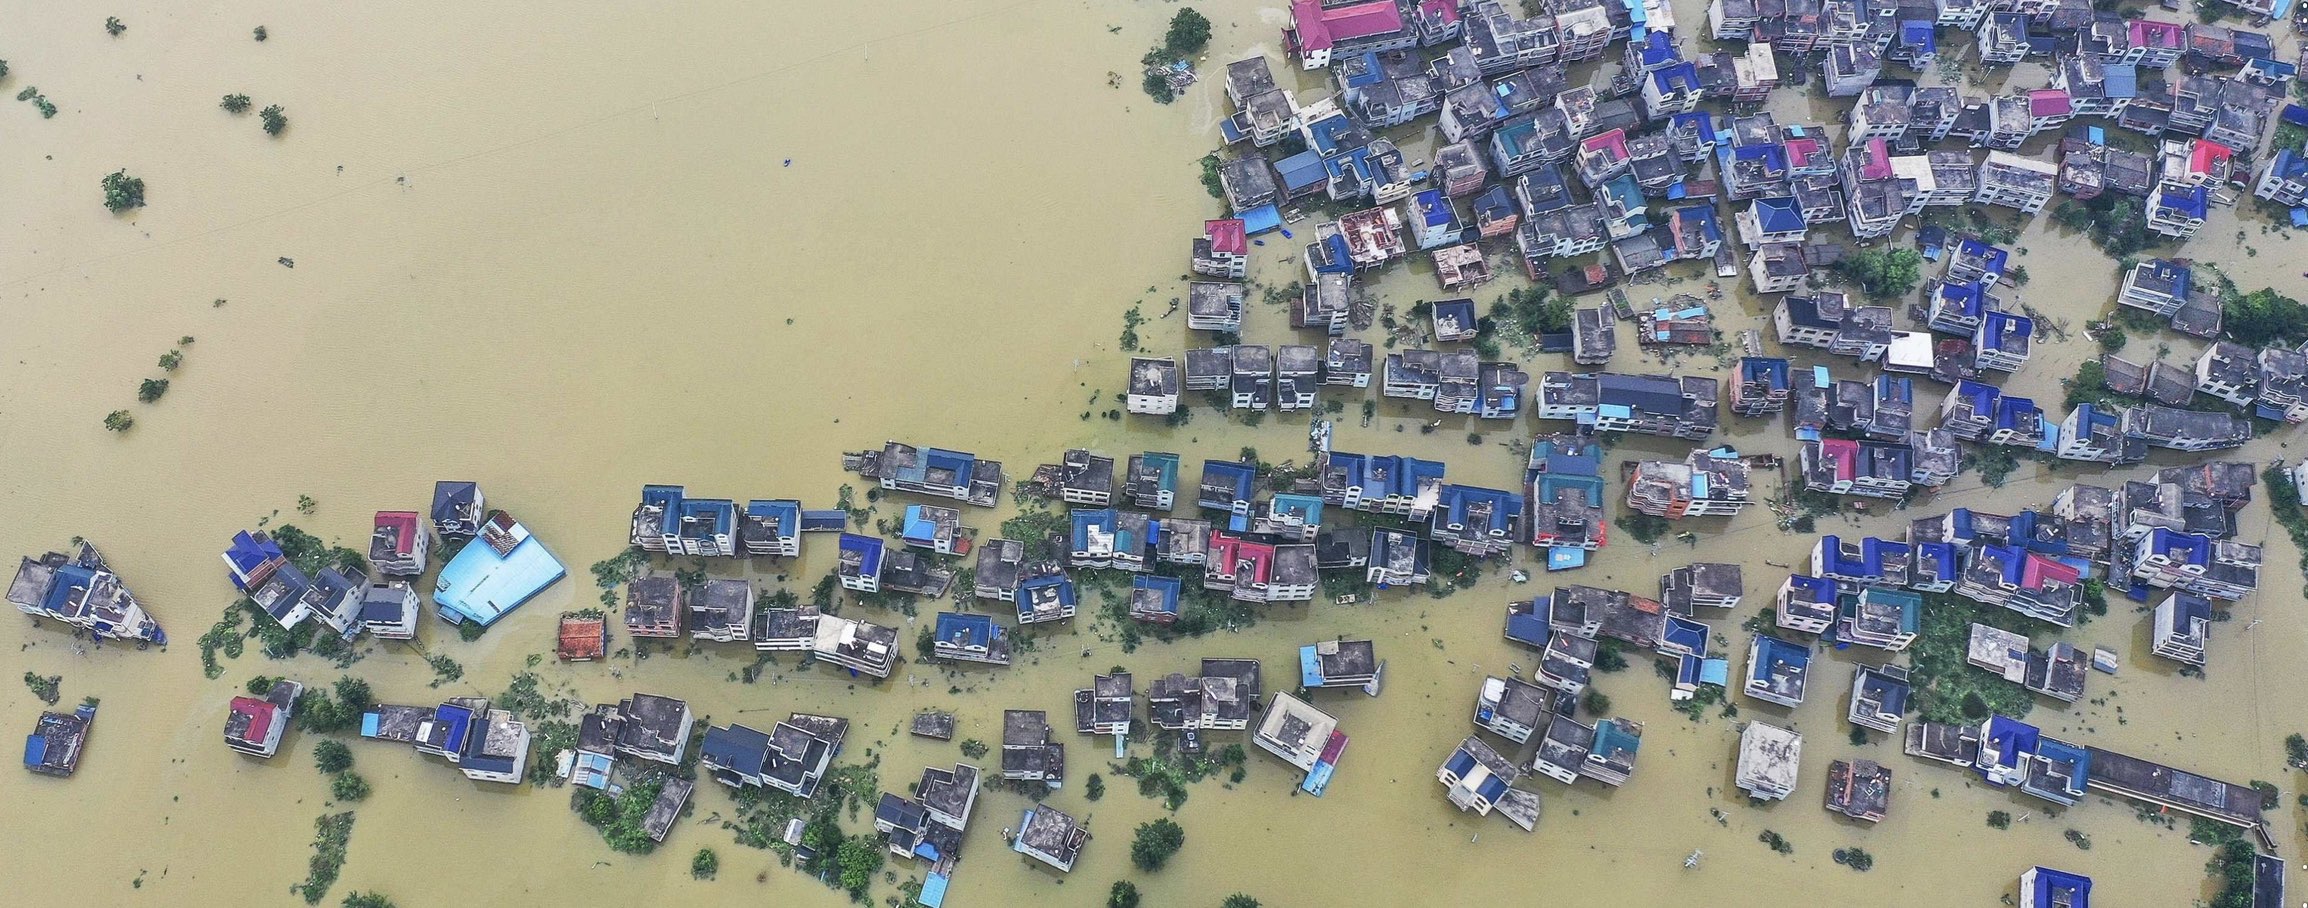
Flooded area in central Jiangxi on July 15 (WSJ)
The changing nature of the Chinese government response.
The government has gone from denying risks to the dam, to admitting that deformations of some sort have occurred. More tellingly, the project is no longer hailed as the means to tame the Yangtze, as it once was in the 1990s and early 2000s. Premier Li Peng pushed the project through the National People’s Congress in 1994, though with a surprisingly low 65% approval. Flood control was supposed to help the party tame nature.
But this week, Zhang Shuguang, director of the Three Gorges Corporation’s Hub Management Bureau, reportedly “warned that flood control measures for the entire Yangtze River Basin could not rely on the Three Gorges Dam to control flooding as his paramount task would be to ensure its own safety.”
At least to me this indicates that the CCP is aware of the foundation and structural risks, and the likely lower safety ratio, and is mitigating them by releasing reservoir waters. They must have calculated that the political cost of increased flooding downstream far outweighs the risk and cost of the dam becoming more unstable.
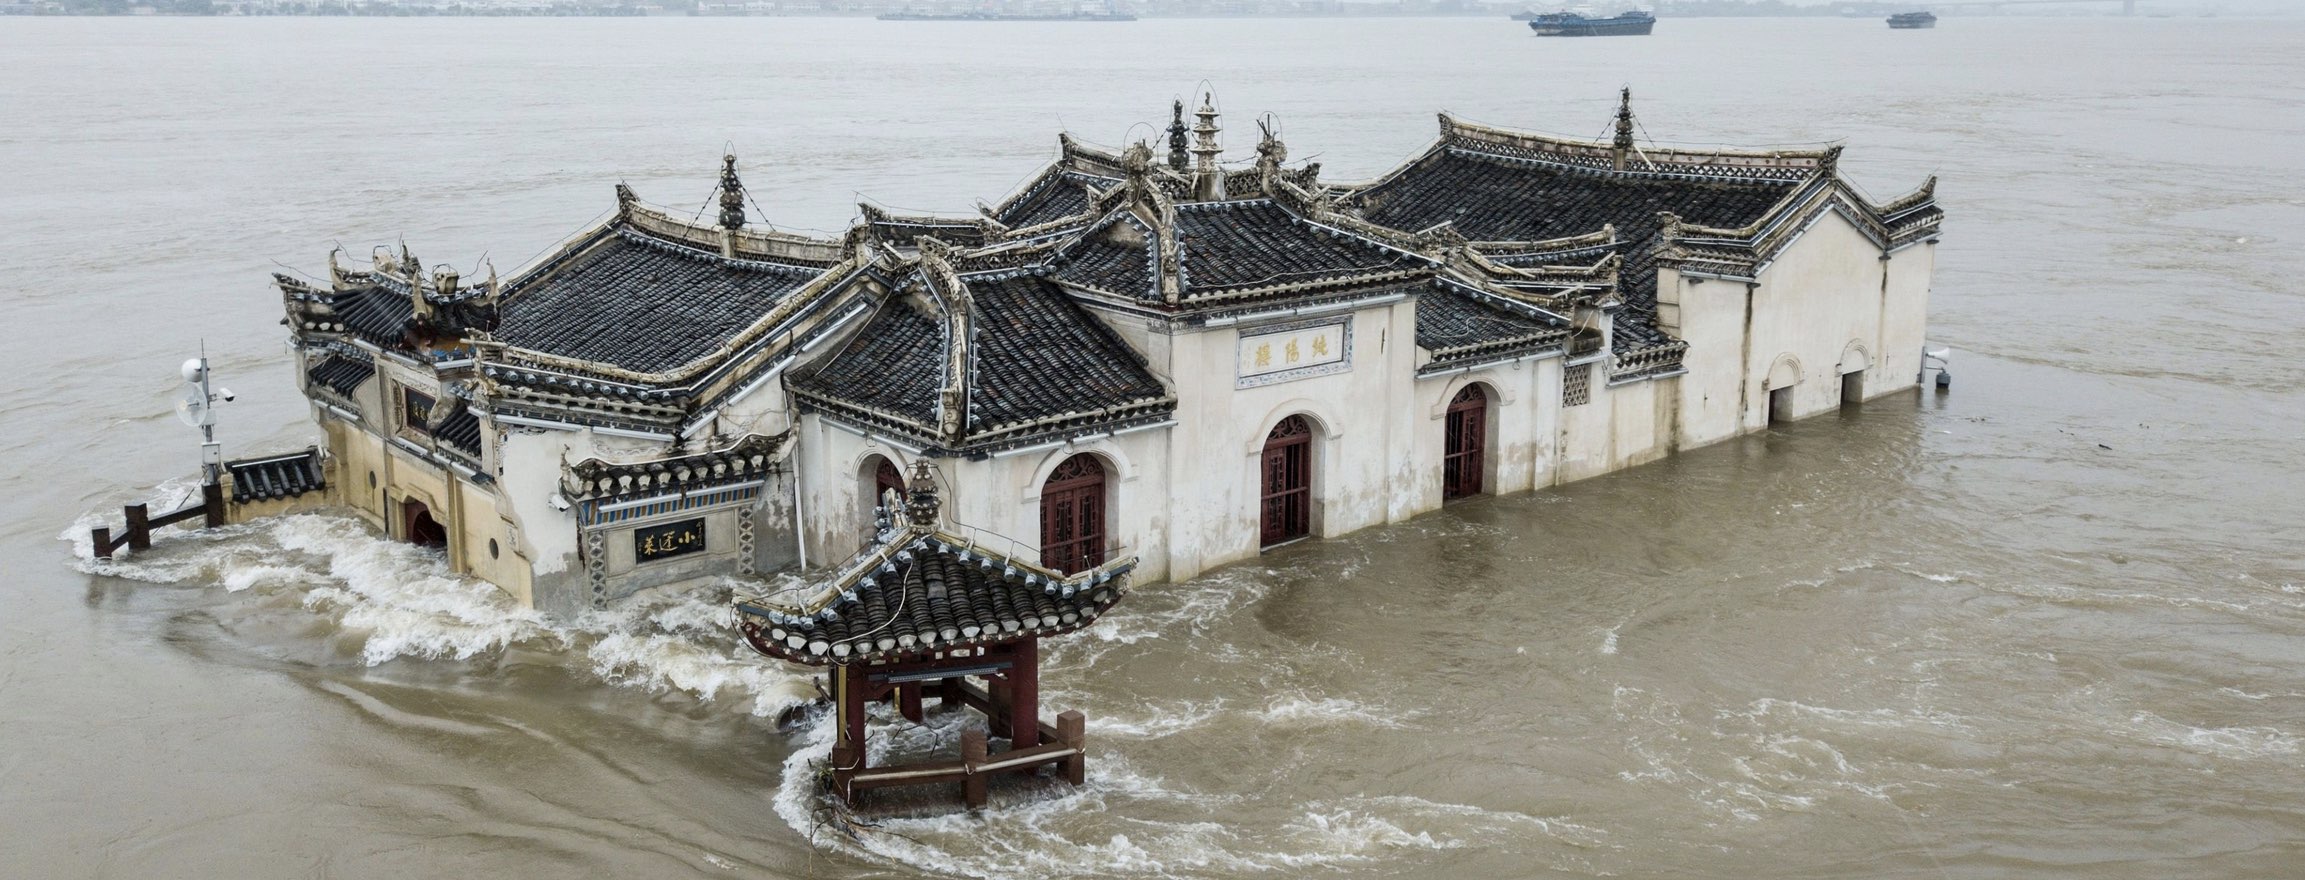
Flooded Guanyin temple, 700-years old, in Wuhan on July 17 (WSJ)
Shock risk: earthquakes and floods
The TGD is subject to seismic and flooding risks, which could present external shocks. Both of these risks also happen to reinforce each other. The TGD sits in an area where there has been seismic activity in the last few years. What’s worrying is that the reservoir has made the area more geologically unstable. Something like this happened at Texas Morris Sheppard Dam, where sliding of the spillway section was discovered in 1986, showing a displacement of 4.5 inches. The main cause was the appearance of uplift pressure from water going through the foundation. As a result, the reservoir waters had to be lowered for two years so repairs could be made.
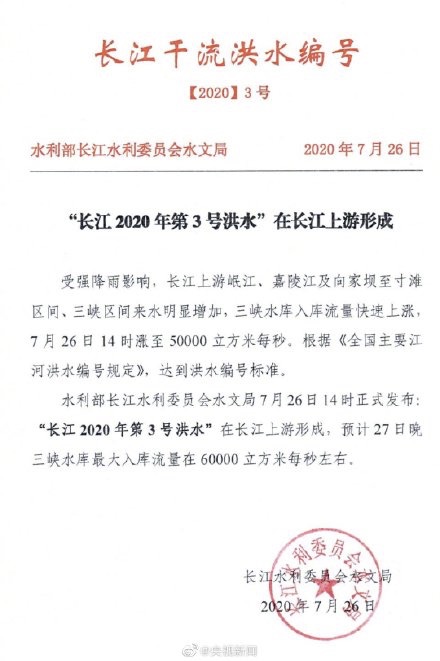
Of potentially more concern is the overlap of large flood waves. The Chinese government announced today, July 26, that the 3rd flood wave has officially formed in the Yangtze. The real risk here is that continuous and overlapping flood waves could raise the reservoir faster than it can drain, increasing the load on the dam and increasing the probability of sliding failure.
Announcement that the 3rd flood wave has arrived on the Yangtze/Changjiang (New Talk)
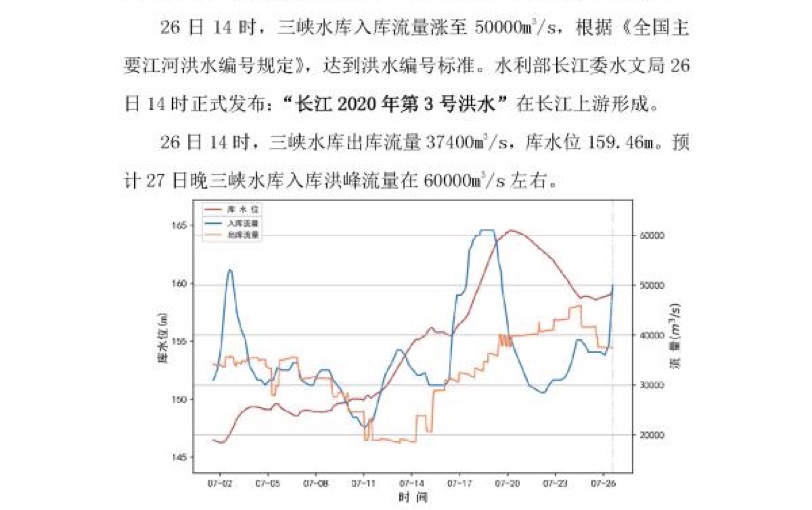
The authorities have indicated that on Sunday, the inflow stood at 50,000m³/s, and would reach 60,000 m³/s6. The current outflow rate, however, is only 37,400m³/s, so the reservoir levels continue to rise.7: The dam reportedly survived inflows of 70,000m³/s in 2012. The spillway is supposed to be able to handle flows of 116,000m³/s. So unless the government miscalculates, or the flood waves arrive faster than expected, there should be no reason for the reservoir to fill up.
July 26 government chart showing the relationship between water level (red), water inflow (blue), and dam outflow (yellow)
Conclusion
The TGD is subject to structural, foundation, and shock risks. Here I assessed primarily the foundation and shock risks, relying on data from the Three Gorges Corporation. Sections 1-5 of the left powerhouse dam are the TGD’s weakest links, given the existence of high-connectivity joints that could produce a sliding failure.
It is clear from the reported deformation events on July 21 that the safety factor has been inflated, and that the dam currently is in a state of instability. The government has implicitly acted to mitigate this risk by opening the spillway and lowering the reservoir to keep the water below 160m, with a corporation representative stating that protecting the dam is their priority. The CCP has opted to incur the political damage from flooding downstream to contain the risk that the dam fails.
As it stands, unless the government severely miscalculates the coming flood waves, there is only a 5% chance of a dam failure, but a 20-25% chance that the dam is structurally compromised and requires extensive interventions and repairs. Should there be an earthquake, however, the probability of failure would likely be closer to 20%, and the chance of structural compromise 80%.
Chuck Anderson, Caroline Mohorovic, Larry Mogck, Bitsy Cohen, Gregg Scott “Concrete Dams Case Histories of Failures and Nonfailures with Back Calculations” DSO-98-05. U.S. Department of Interior, Bureau of Reclamation, Dam Safety Office, December 1998 ↩︎
Jian Liu, Xia-Ting Feng, Xiu-Li Ding, Jie Zhang, Deng-Ming Yue, “Stability assessment of the Three-Gorges Dam foundation, China, using physical and numerical modeling—Part I: physical model tests,” International Journal of Rock Mechanics and Mining Sciences, Volume 40, Issue 5, 2003, Pages 609-631; and Jian Liu, Xia-Ting Feng, Xiu-Li Ding, “Stability assessment of the Three-Gorges Dam foundation, China, using physical and numerical modeling—Part II: numerical modeling,” International Journal of Rock Mechanics and Mining Sciences, Volume 40, Issue 5, 2003, Pages 633-652. ↩︎
Ren ZM, Ma DX, Shen T, Tian Y. Study on rock engineering of the Three-Gorges Dam foundation. Wuhan: Chinese University of Geosciences Press, 1998. p. 253–300 (in Chinese); and Chen DJ. Engineering geological problems in the Three-Gorges Project on the Yangtze China. Eng Geol 1999;51:183–93. ↩︎
So \( P=(1000\textrm{kg}/\textrm{m}^3)*(9.81\textrm{m}/\textrm{s}^2)(h\textrm{m}) \), therefore \(P=h\cdot9810\textrm{kg}\cdot \textrm{m}^{-1}\textrm{s}^{-2} \) ↩︎