TL;DR: Crypto is not one thing–it is two asset types sharing the same name:
deflationary stores of value, of which Bitcoin is the most important
smart contract applications, of which DeFi is the paradigmatic example
Deflationary assets are “digital gold” likely to suffer a modern-day “Volcker Shock” as the Fed raises rates this year. Their long-term price hinges on Jerome Powell’s (in)ability to slay the inflationary dragon.
Smart contract assets are closer to Internet stocks, trading at a discount in the mid-2000s before sustained appreciation in the 2010s. DeFi protocols in particular have significant traction but in search of viable monetization models, recalling the early days of today’s dominant tech platforms.
Both deflationary and smart contract assets are put options on our overly-regulated financial system, and both will suffer when the Fed hikes rates this year. But their different approaches will in time lead them to de-couple.
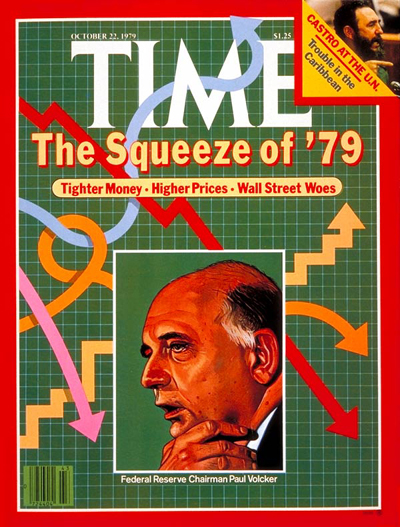
Paul Volcker nominated chairman of the US Federal Reserve.
Introduction
At the close of 1979, President Jimmy Carter nominated Paul Volcker to chair the US Federal Reserve. Volcker was a man with a “dragon to slay.” The US had suffered from a decade of low growth and high inflation, a consequence of Keynesian monetary expansion produced by President Lyndon Johnson’s War on Poverty and the Vietnam War. Volcker remembers that “There was this feeling of malaise, to use a term (popular) at the time. There was a kind of great speculative pressure. It was the years when everybody wanted to buy collectibles from New York. The market was booming, and other markets of real things were booming, because people had got the feeling that things were inflating and there was no way you could stop it."1 And slay the dragon he did. Volcker raised interest rates, increasing the cost of credit and reducing money creation. But this disproportionately hurt credit-dependent businesses such as real estate developers, who had “hundreds of two-by-fours delivered to the office” in protest.
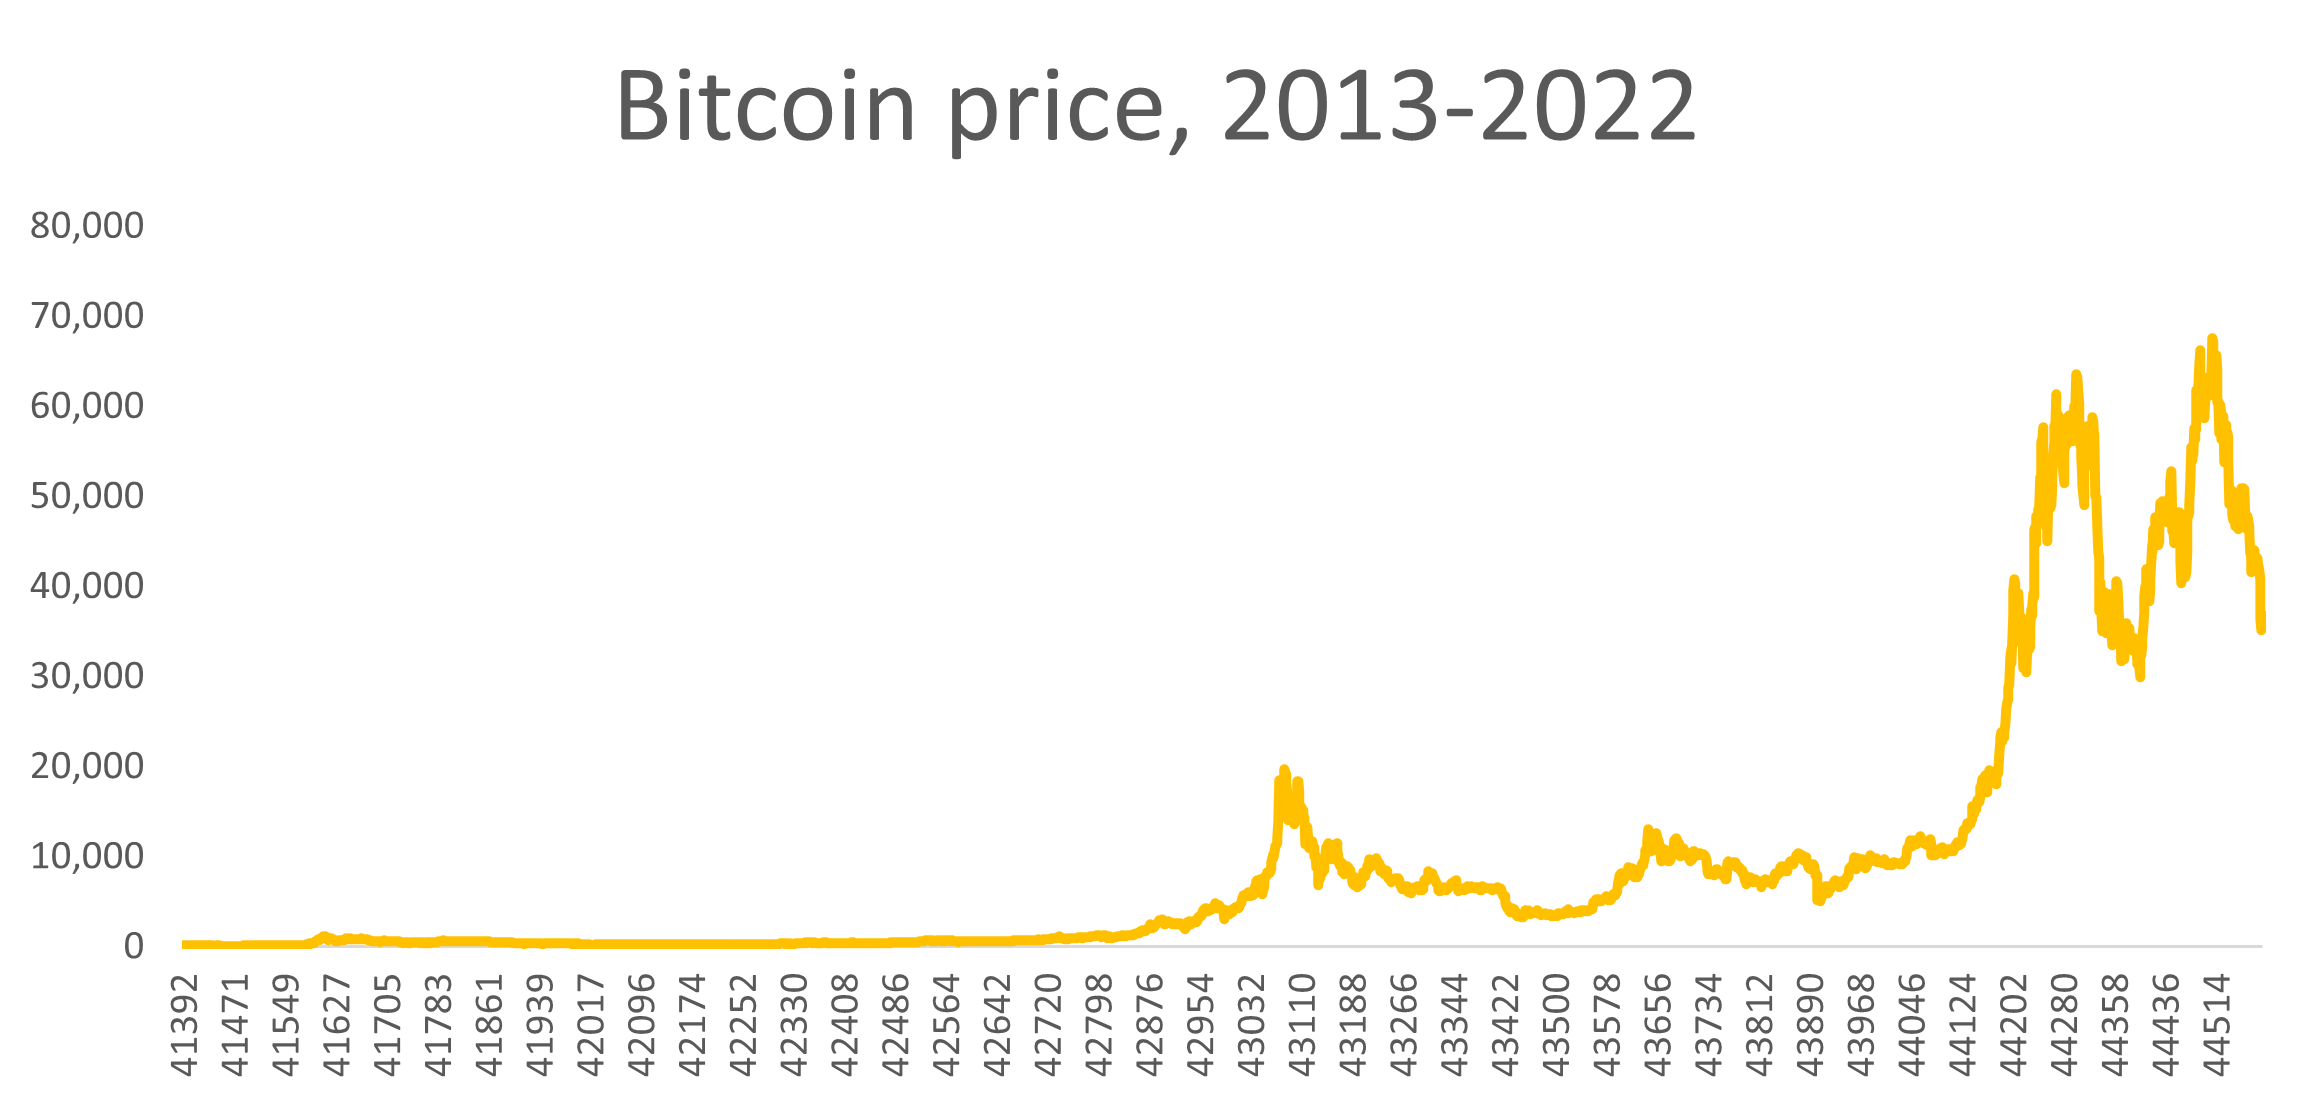
In 2020, COVID lockdowns and Fed policy summoned back the dragon by creating both inflationary supply shocks and inflationary monetary expansion. All manner of asset prices boomed, from real estate to tech stocks. Even lumber two-by-fours were back in the news.2 But crypto assets surged fastest of all, with Bitcoin rising thirteen times over from $5,000 to $67,000. Yet today crypto assets are down 45% from their November 2021 all-time-highs, when their combined market cap peaked at $2.95 trillion. This broad sell-off was driven by the belief that the Federal Reserve, led by Jerome Powell, will seek to slay the inflationary dragon much as Volcker did. Now that equities markets have caught up with crypto, the question remains—is this crypto’s Volcker Shock?
Crypto, however, is not one thing. It is two very different types–deflationary stores of value and smart-contract applications. Whether “crypto” is going through 1979, 1999, or 2008—a Volcker Shock, DotCom Crash, or Great Recession—depends on which type “crypto” we’re talking about.
Deflationary Assets: Volcker Shock Redux?
Bitcoin is the largest and most important deflationary asset. Born in the aftermath of the 2008 financial crisis, Bitcoin’s design was premised on the idea that central banks debase the fiat currencies they manage. Bitcoin’s decentralized ledger tracks a fixed supply of 21 million coins, in contrast to the “unlimited” dollars that Satoshi Nakamoto and others believed the Fed will ultimately print. Years after Bitcoin’s invention, however, inflation in developed countries remained tame. Thus, despite the idea that Bitcoin was a hedge against the large-scale depreciation of the dollar, Bitcoin seemed to be a better solution for developing countries in Latin America and Africa.
The view that Bitcoin was a sort of “digital gold” and “store of value” against inflation was not immediately dominant. Enthusiasts retained hope that Bitcoin would function as digital cash, useful for everyday transactions, such as the famous “Bitcoin Pizzas” which a Florida man in 2010 bought for 10,000 Bitcoins—coins which would today be worth $360 million. But fundamental limits on Bitcoin’s transaction throughput—a product of both the small size and infrequency of the blocks in its blockchain—meant that Bitcoin-the-money had to give way to Bitcoin-the-asset. And so, until 2019, all crypto assets were basically riding Bitcoin’s coattails—they had no other use besides their inflation-resistant, rules-based supply.
Gold served a similar inflation-hedging role in the post-Bretton Woods world. Between 1944 and 1971, the US dollar had been pegged to gold at a value of $35 per ounce. Guided by Keynesian ideas, the US and other European countries had used government spending to raise aggregate demand and thus employment, which without concomitant tax hikes increased the money supply. This strained the Bretton Woods system until President Nixon ended gold convertibility in 1971.
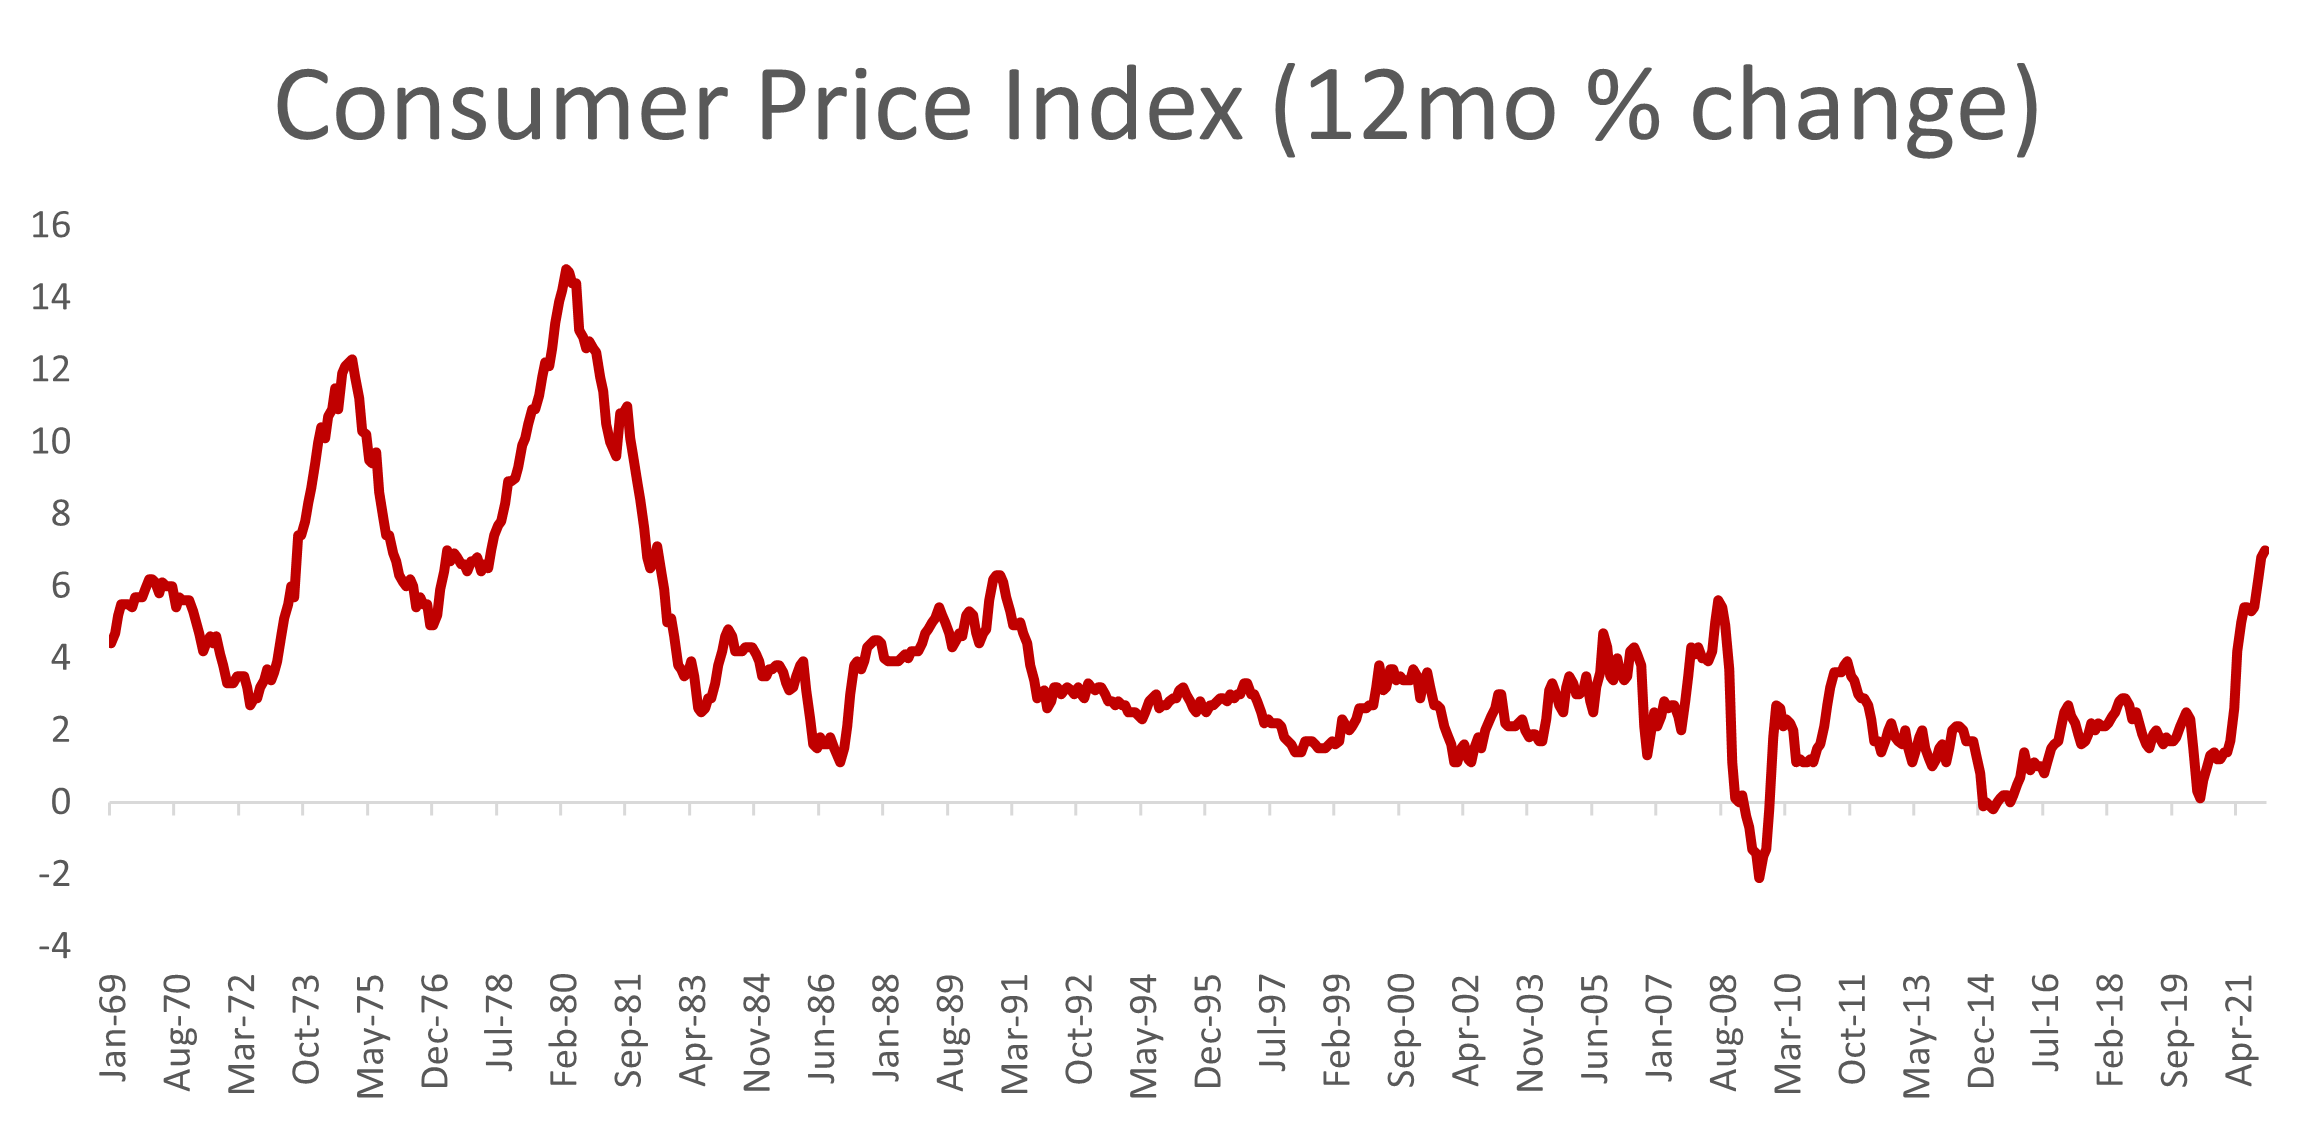
Unfortunately, Western industrialized countries were quickly beset by supply disruptions in the wake of the 1973 oil shocks and entered a period of stagflation—low growth and high inflation. President Carter appointed Paul Volcker to serve as Fed chair in 1979, and Volcker quickly moved to slay the dragon of US inflation, which peaked in March of 1980 at 14.8%. Volcker took extraordinary steps. He remarked in 2000 that “If you had told me in August of 1979 when I became chairman of the Federal Reserve Board that interest rates, the prime rate would get to 21.5 percent, I probably would have crawled into a hole and cried, I suppose. But then we lived through it.”
Source: Burueau of Labor Statistics (BLS).
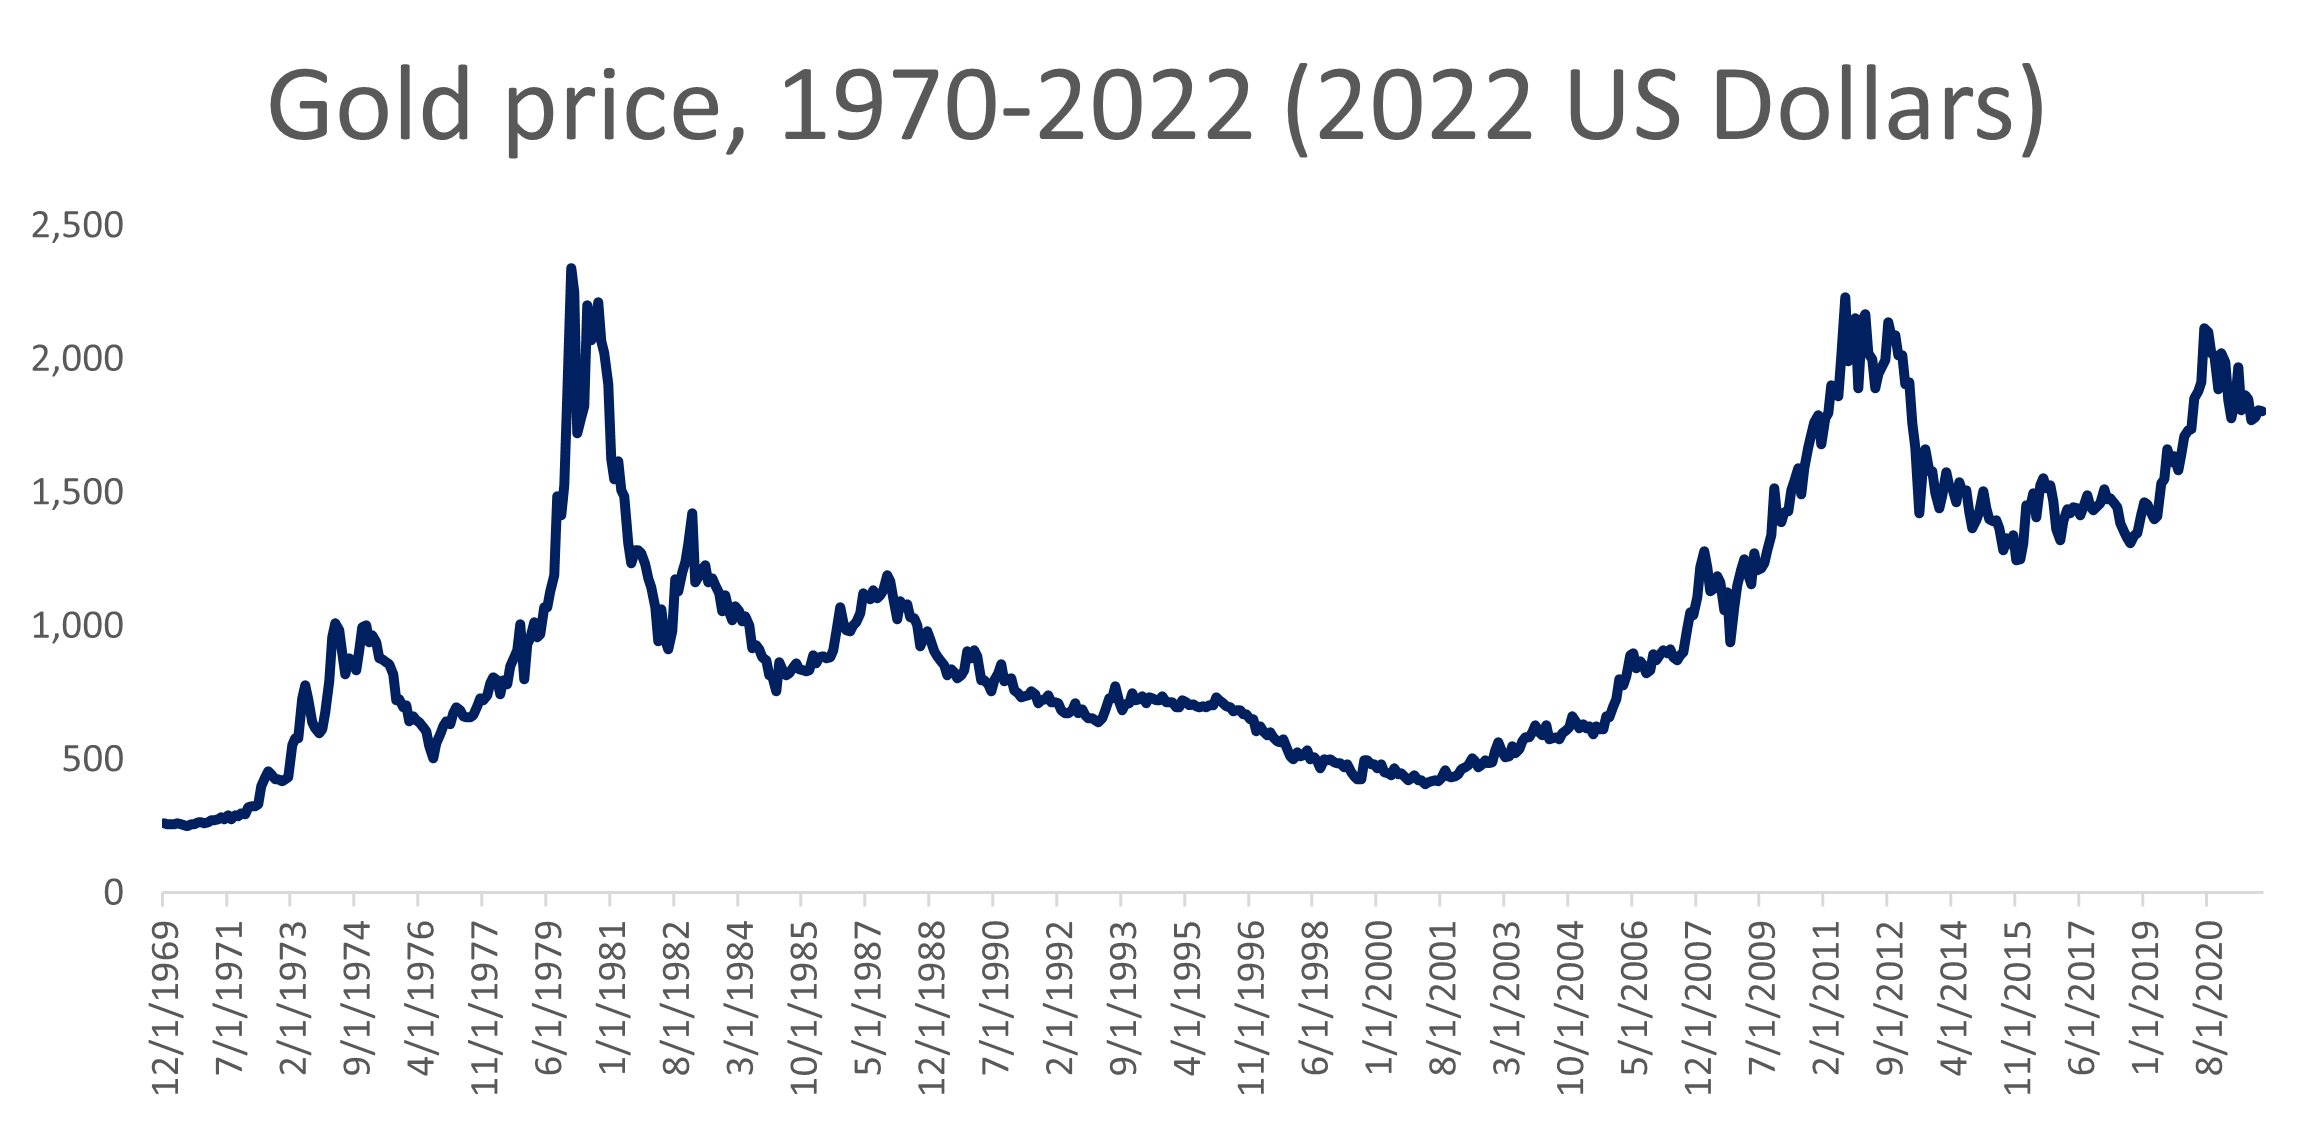
As a hedge against inflation, gold boomed before Volcker and went bust after his appointment. In 2022-dollar terms, gold peaked on January 31, 1980 at $2,340 per ounce. A year and month later it stood at $1,555, before hitting new lows on June, 1982 at $912, and on February, 1985 at $756. In percentage terms these represented drops of 33%, 61%, and 68%.
Source: World Gold Council; BLS; author's calculations.
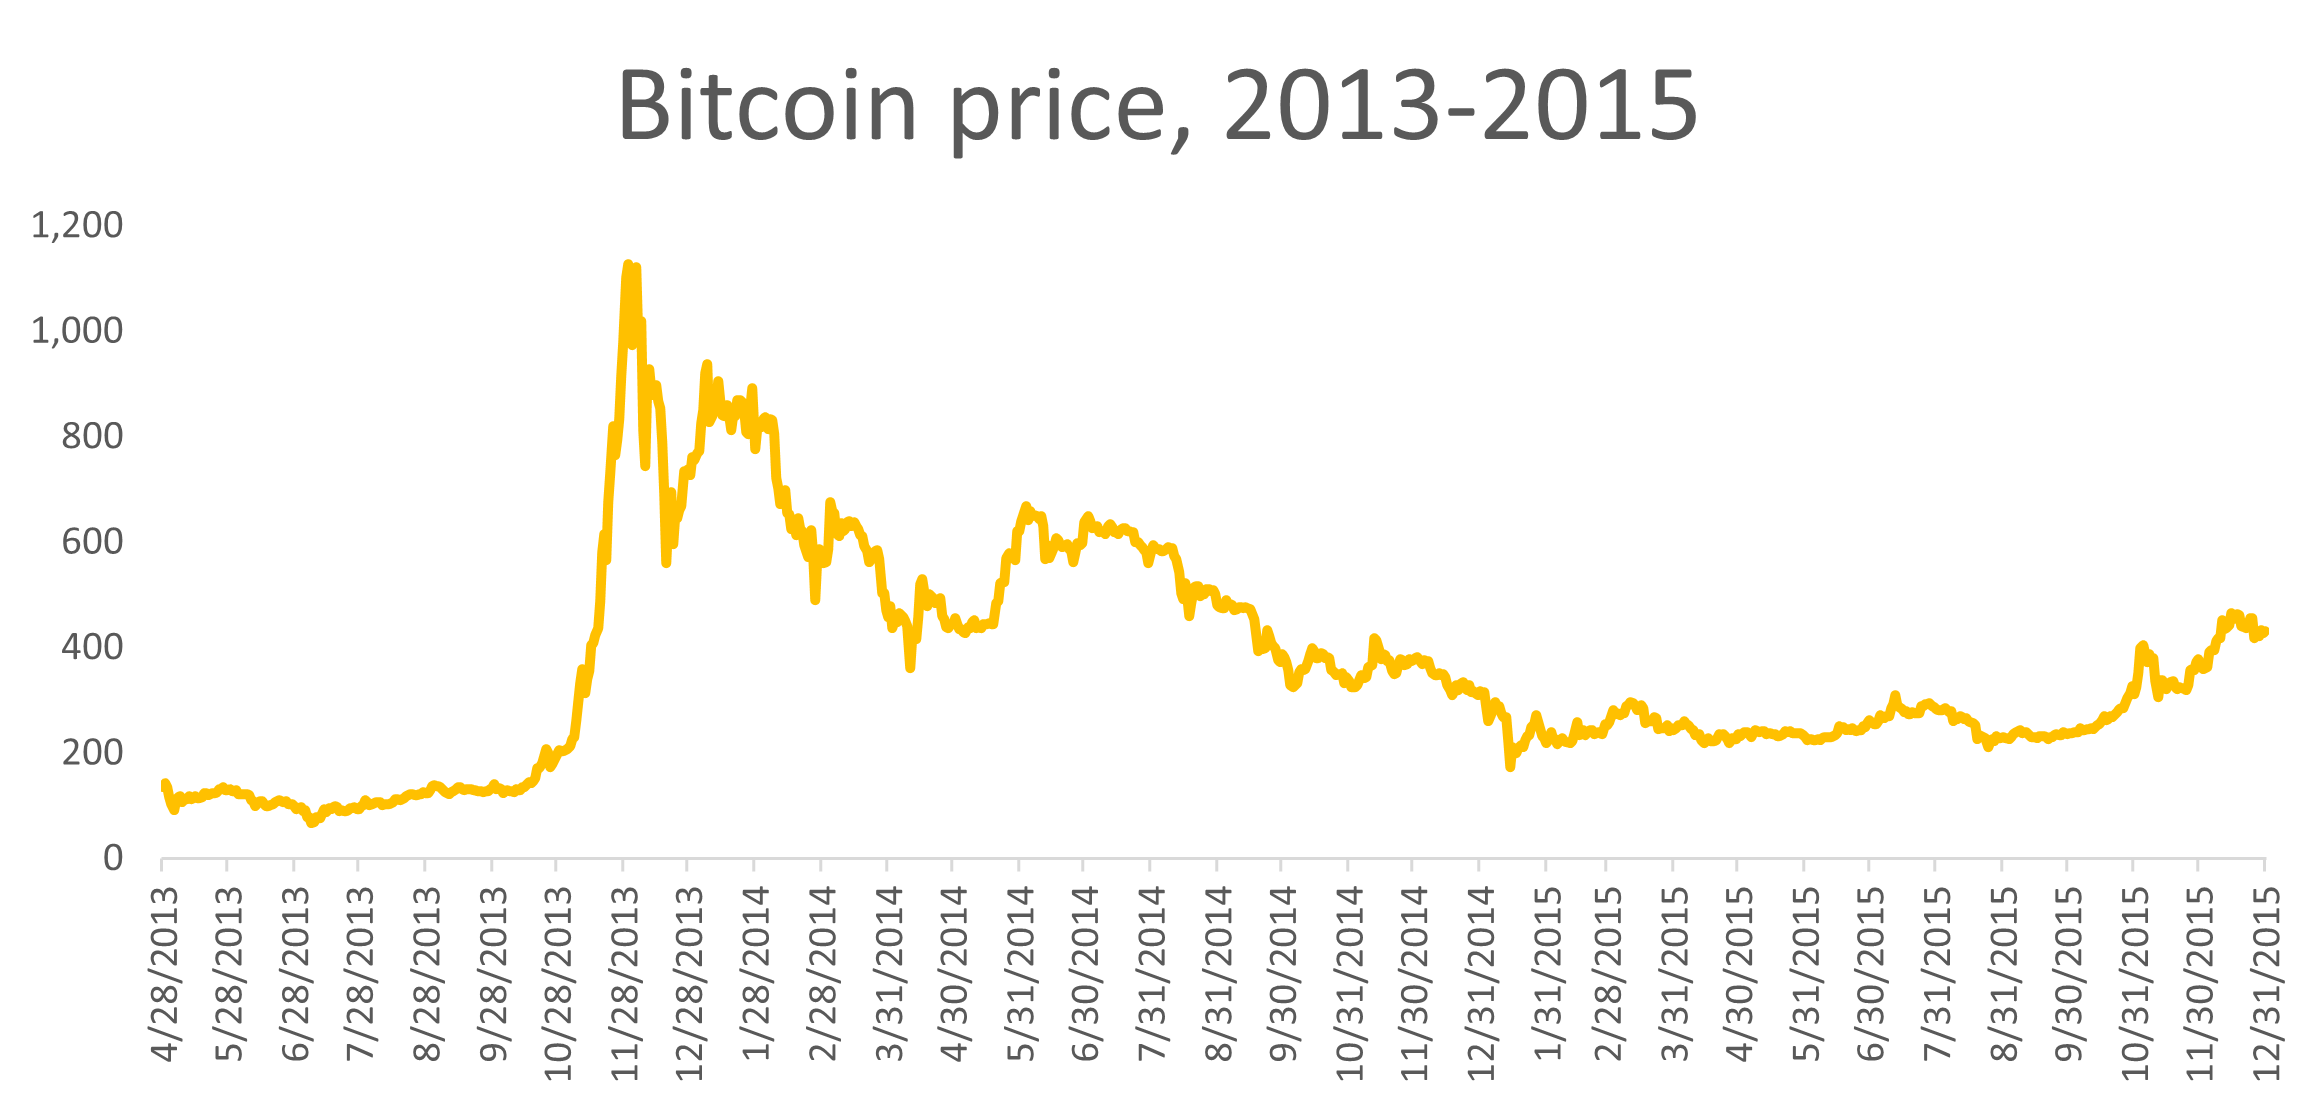
Bitcoin is more volatile than gold, dropping over 80% from peak to trough. For example, during the first Bitcoin bubble prices peaked on November 30, 2013, and bottomed out a little over a year later on January 14, 2015. Altogether the price dropped 85% from $1,127 to $127.
Source: CoinGecko.
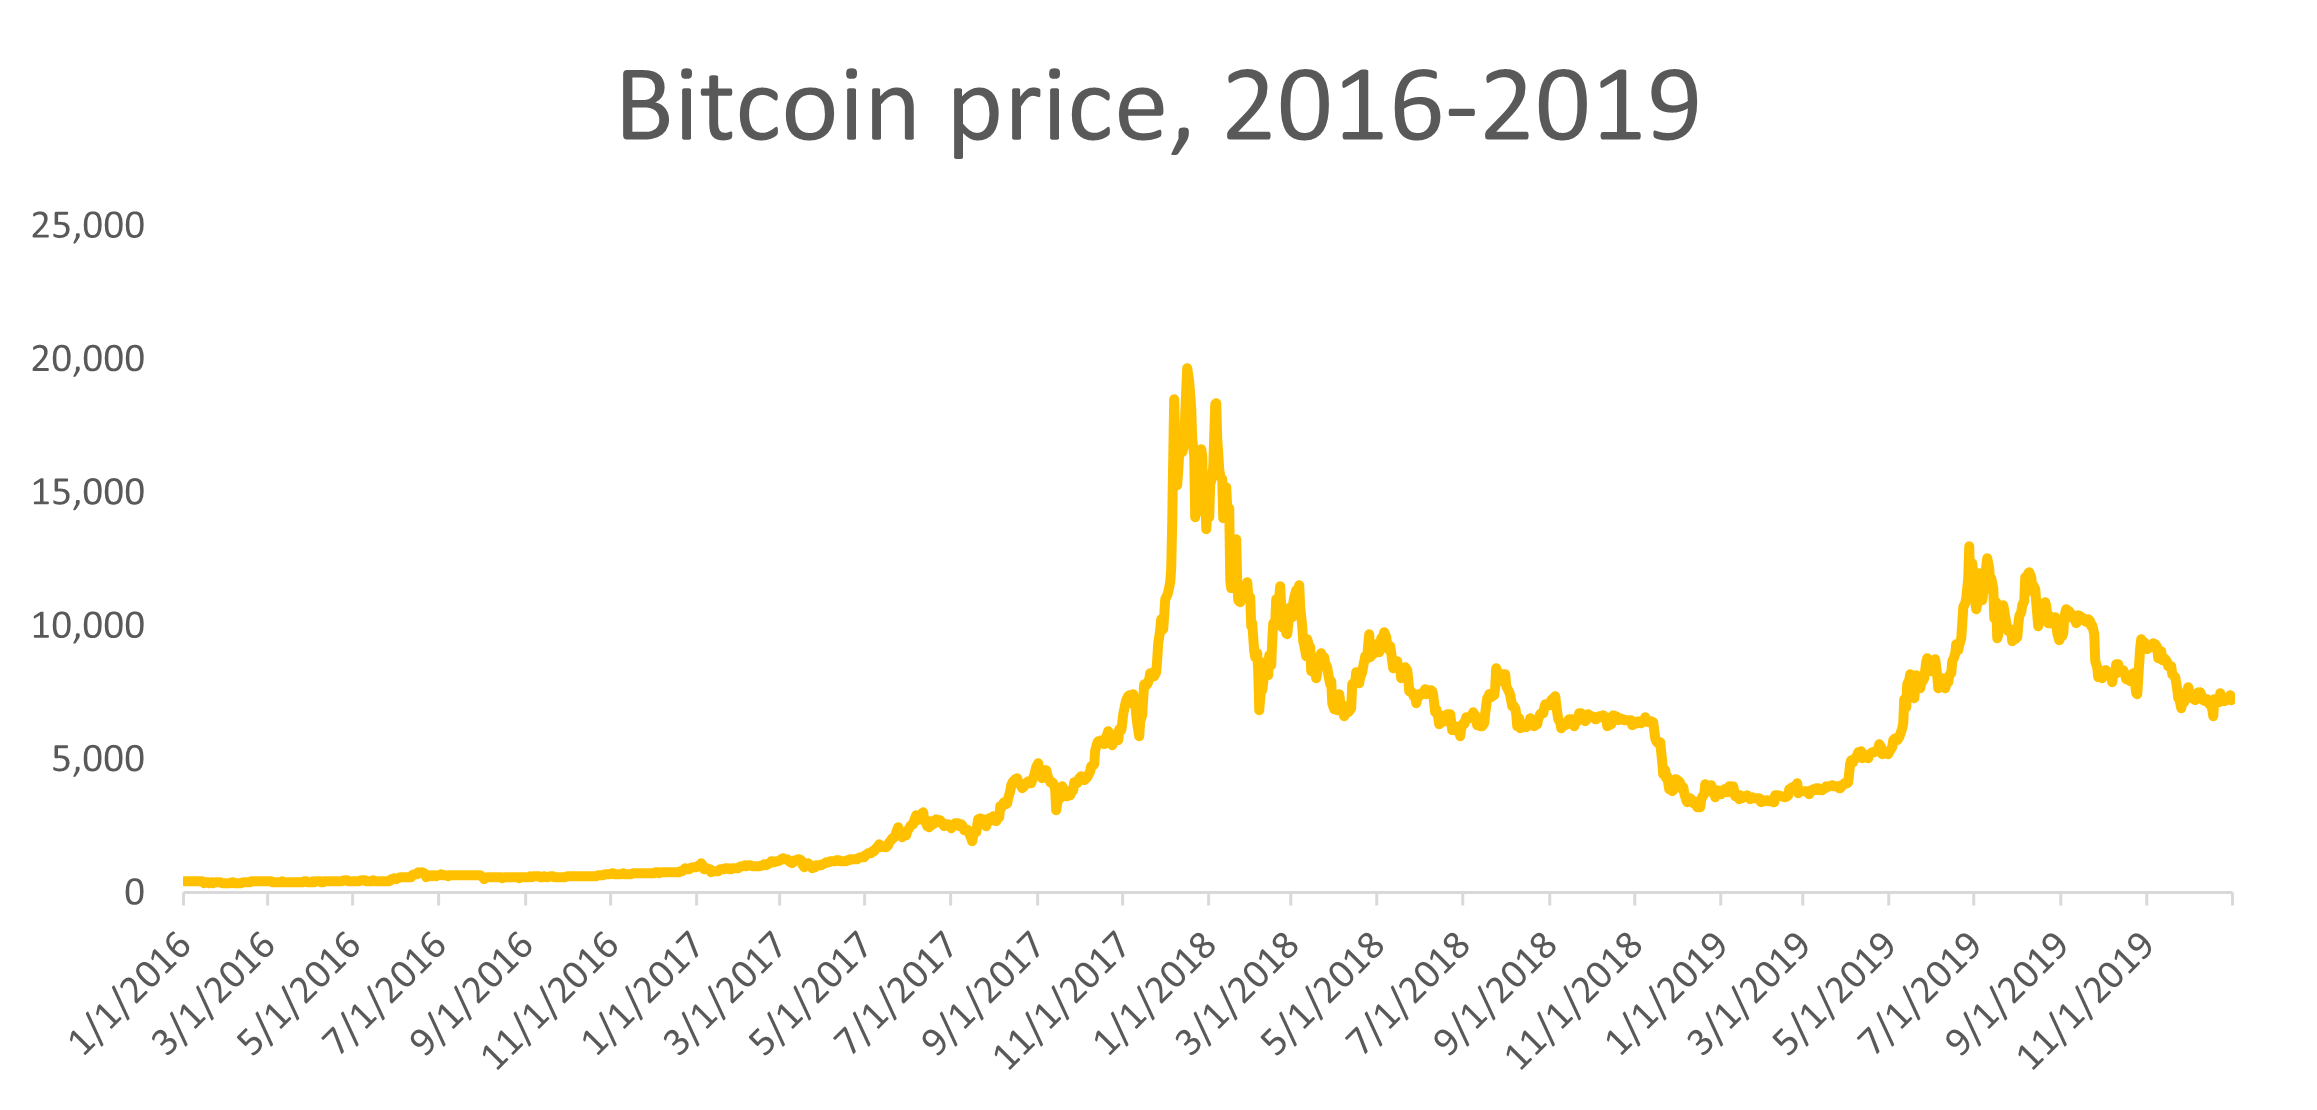
The second Bitcoin bubble occurred in 2017. The price peaked on December 16, 2017 at $19,665 and bottomed out a year and a day later on December 17, 2018 at $3,217—a drop of 84%.
Source: CoinGecko.
Could prices this year drop 85% from their November peak? Were the historical pattern to repeat exactly, prices would fall from $67,617 and bottom out a year later around $10,143. This seems unlikely—Bitcoin today is a much larger asset than it was last decade–its market cap had increased 1000 times to just over a trillion. Size alone will have reduced volatility somewhat. But more importantly, were Bitcoin to fall to $10,000, I and many others would consider that a bargain, which leads me to believe it will be bid back up well above that level. Were Bitcoin “merely” experience its own Volcker shock, it would only drop to $29,751, which doesn’t feel like a bargain!
Source: CoinGecko.
Yet for an asset whose primary purpose is hedging inflation, our central bank’s commitment to slay inflation could impair its short- to medium-term value, but by how much? On the one hand, gold’s market cap is $11 trillion, while Bitcoin just broke $1 trillion last year. Volcker wiped out 68% of gold’s value. But Bitcoin is more volatile, so a larger drop is possible. On the other hand, while Jerome is heir to Paul, the US is in a different place macroeconomically today than in the 1970s. Our national debt is larger, government spending is far higher, and growth has been lower.3 So it is extremely unlikely that Powell will hike rates as quickly and as aggressively as Volcker. If anything, markets are already trying to guess when the Fed will “blink” and ease rates. The dragon might yet live another day.
Smart Contracts: DotCom Crash or Great Financial Crisis?
But deflationary assets are not the only type of “crypto”—there are also smart contract assets, of which Ethereum is the largest and most important. Ethereum was launched in 2015 as a “world computer” capable of executing code across a decentralized network of machines. This stands in contrast to Bitcoin, which only stores a decentralized ledger across its network.
My own personal bias is that decentralized finance (DeFi) is the most promising and interesting segment of smart contract crypto—from on-chain asset exchanges to in-game item markets, DeFi is a powerfully interoperable approach the transfer and transformation of economic value.
Smart-contracts have also been used to launch and sell non-fungible tokens (NFTs), representing collectibles, and amusing “meme” tokens such as Shiba. NFTs and meme coins, however, are close cousins of Bitcoin. Their value lies only in their “digital scarcity.” Christie’s sold CryptoPunks because there were only ever going to be 10,000 items in the collection.
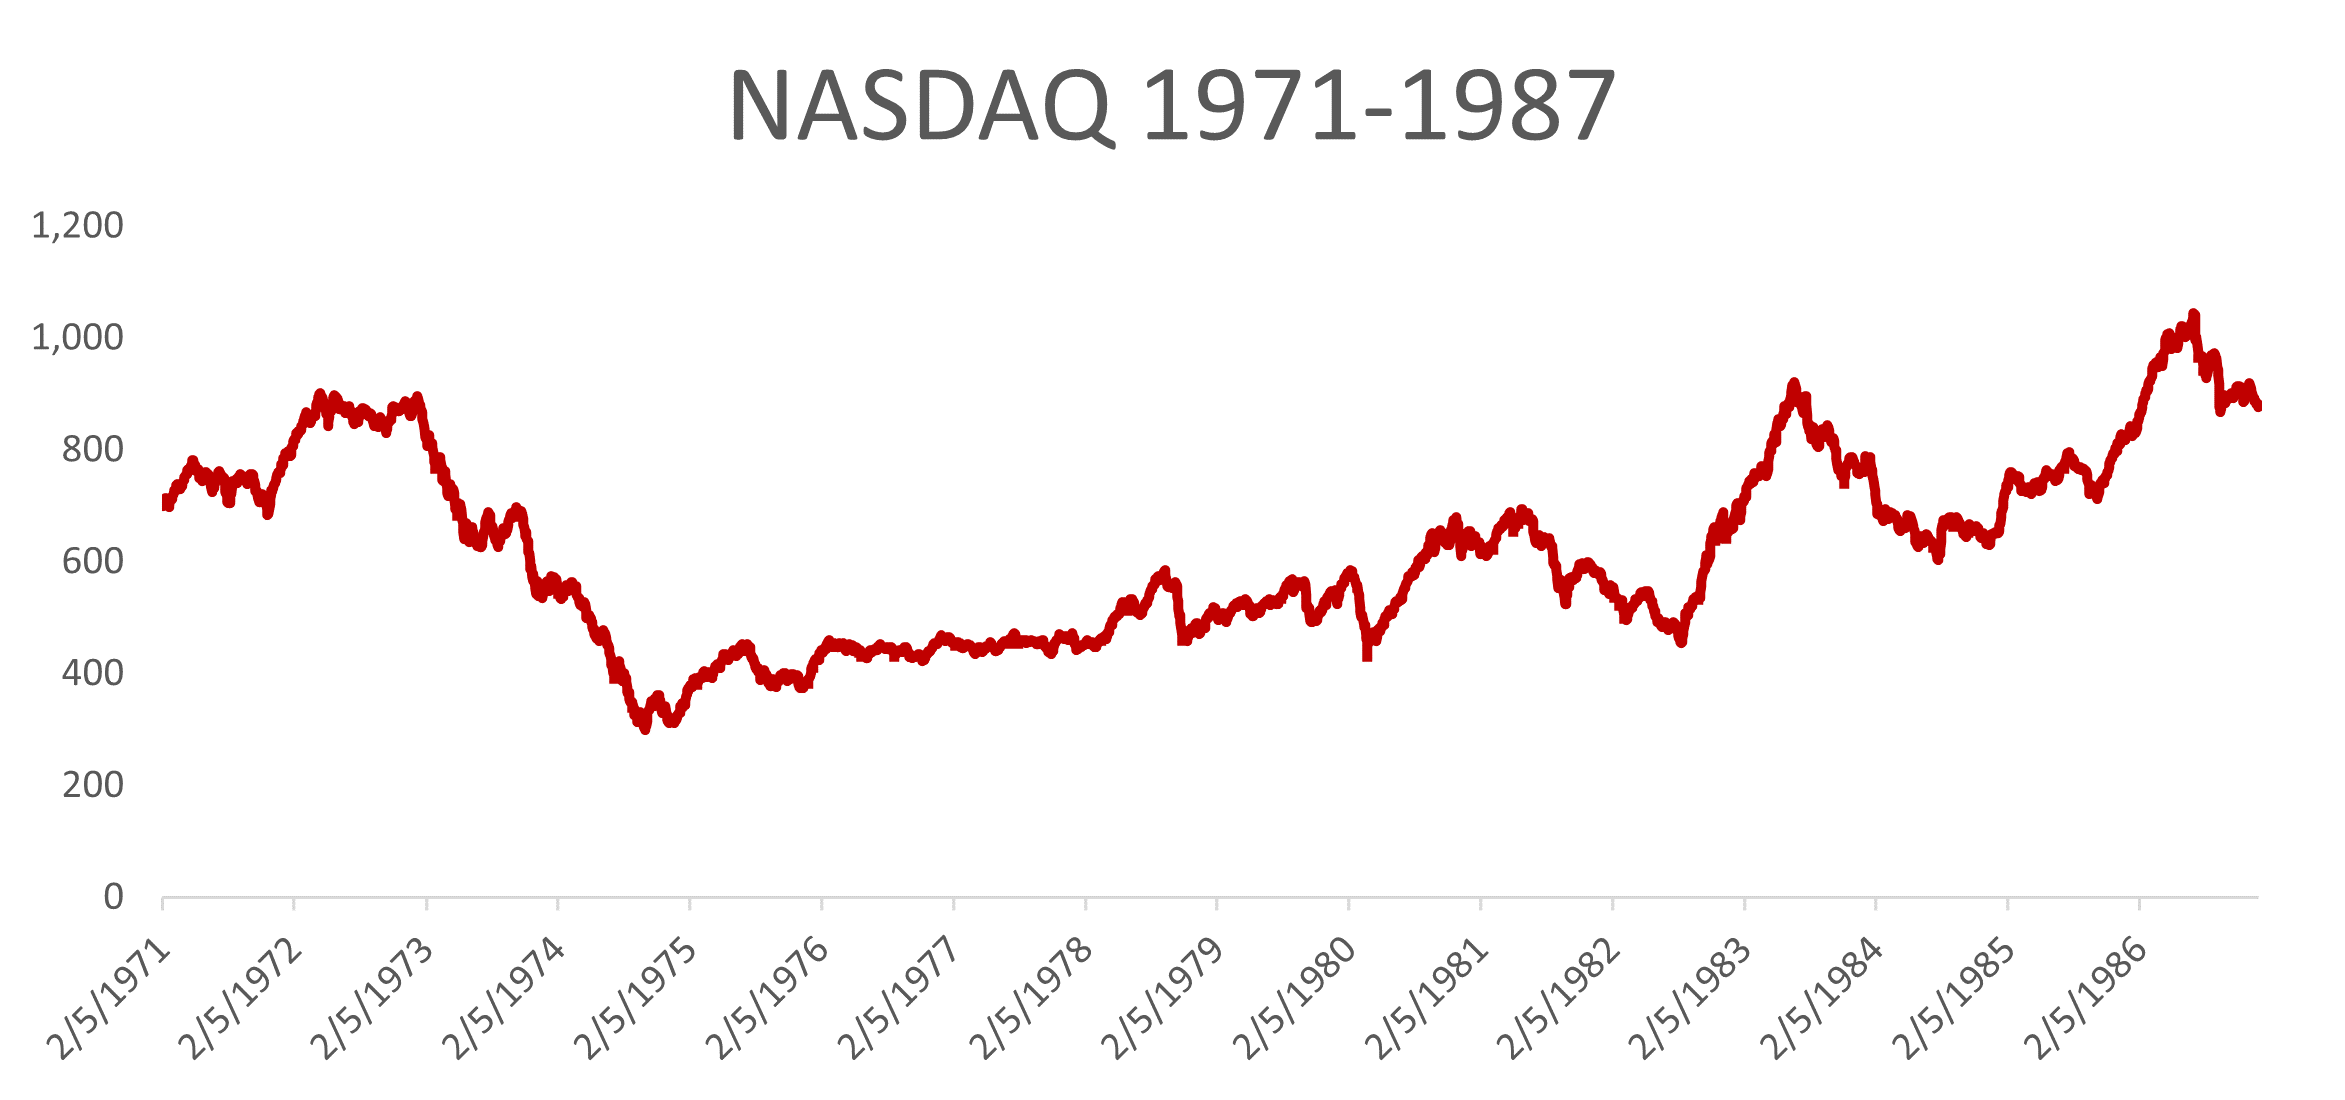
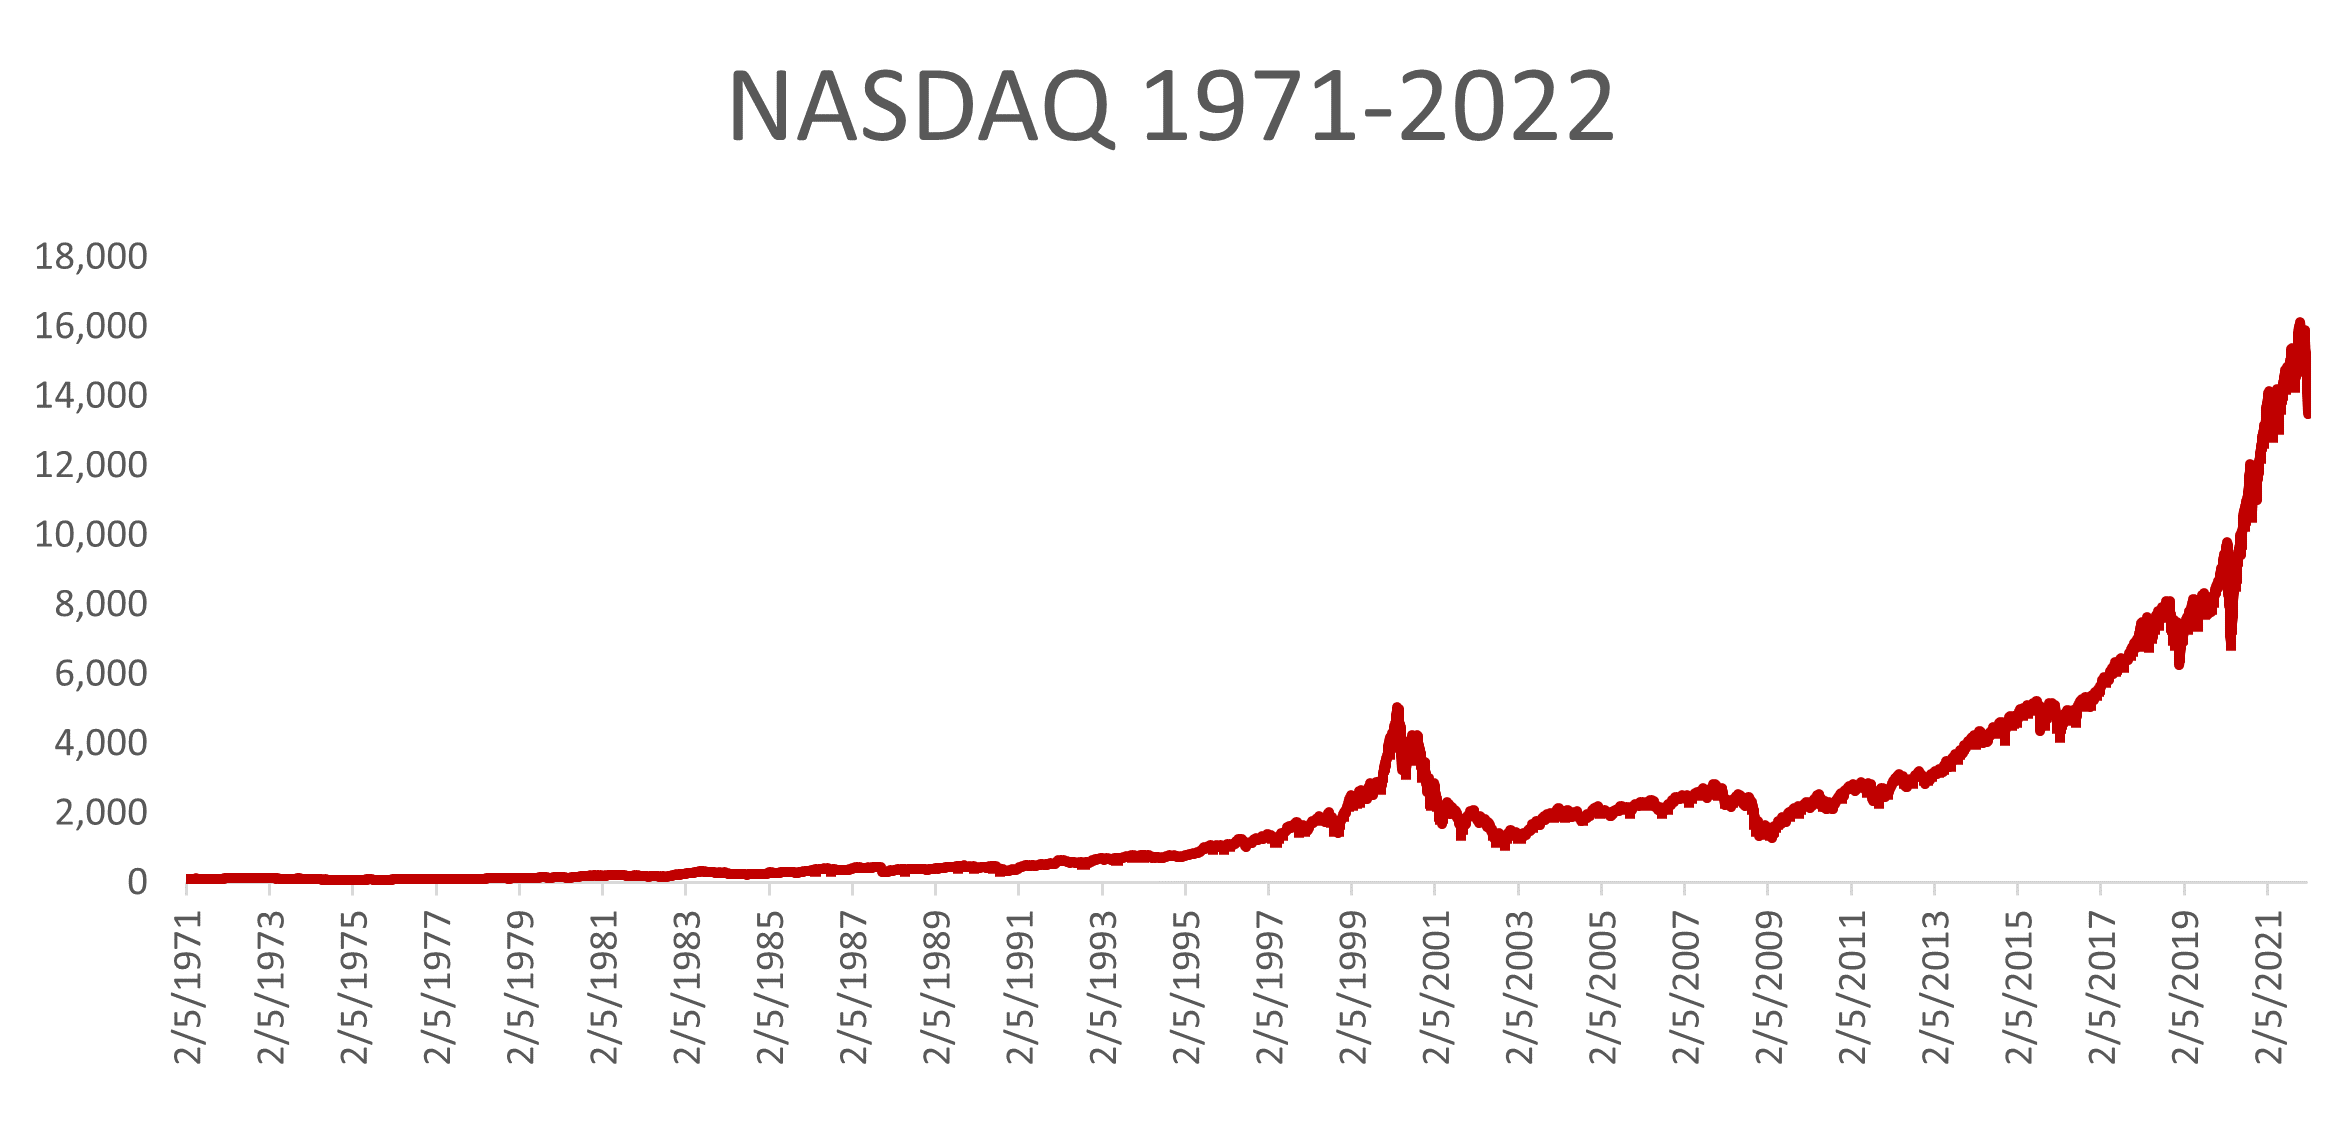
So leaving NFTs and meme coins aside, DeFi looks more like DotCom stock than digital gold. If we look to the history of the NASDAQ, we see it suffered a drop of 66% after the 1973 oil shock, analogous perhaps to the DeFi selloff in March 2020 as governments announced COVID-19 lockdowns. But the NASDAQ did not move much in response to Volcker’s inflation-fighting policies in 1980. Thus the question is not whether DeFi will have a Volcker Shock—DeFi undoubtedly sell-off alongside Bitcoin. The question is whether in the long-term DeFi behaves like Internet stock after 1999 or 2008, or continues trading like digital gold.
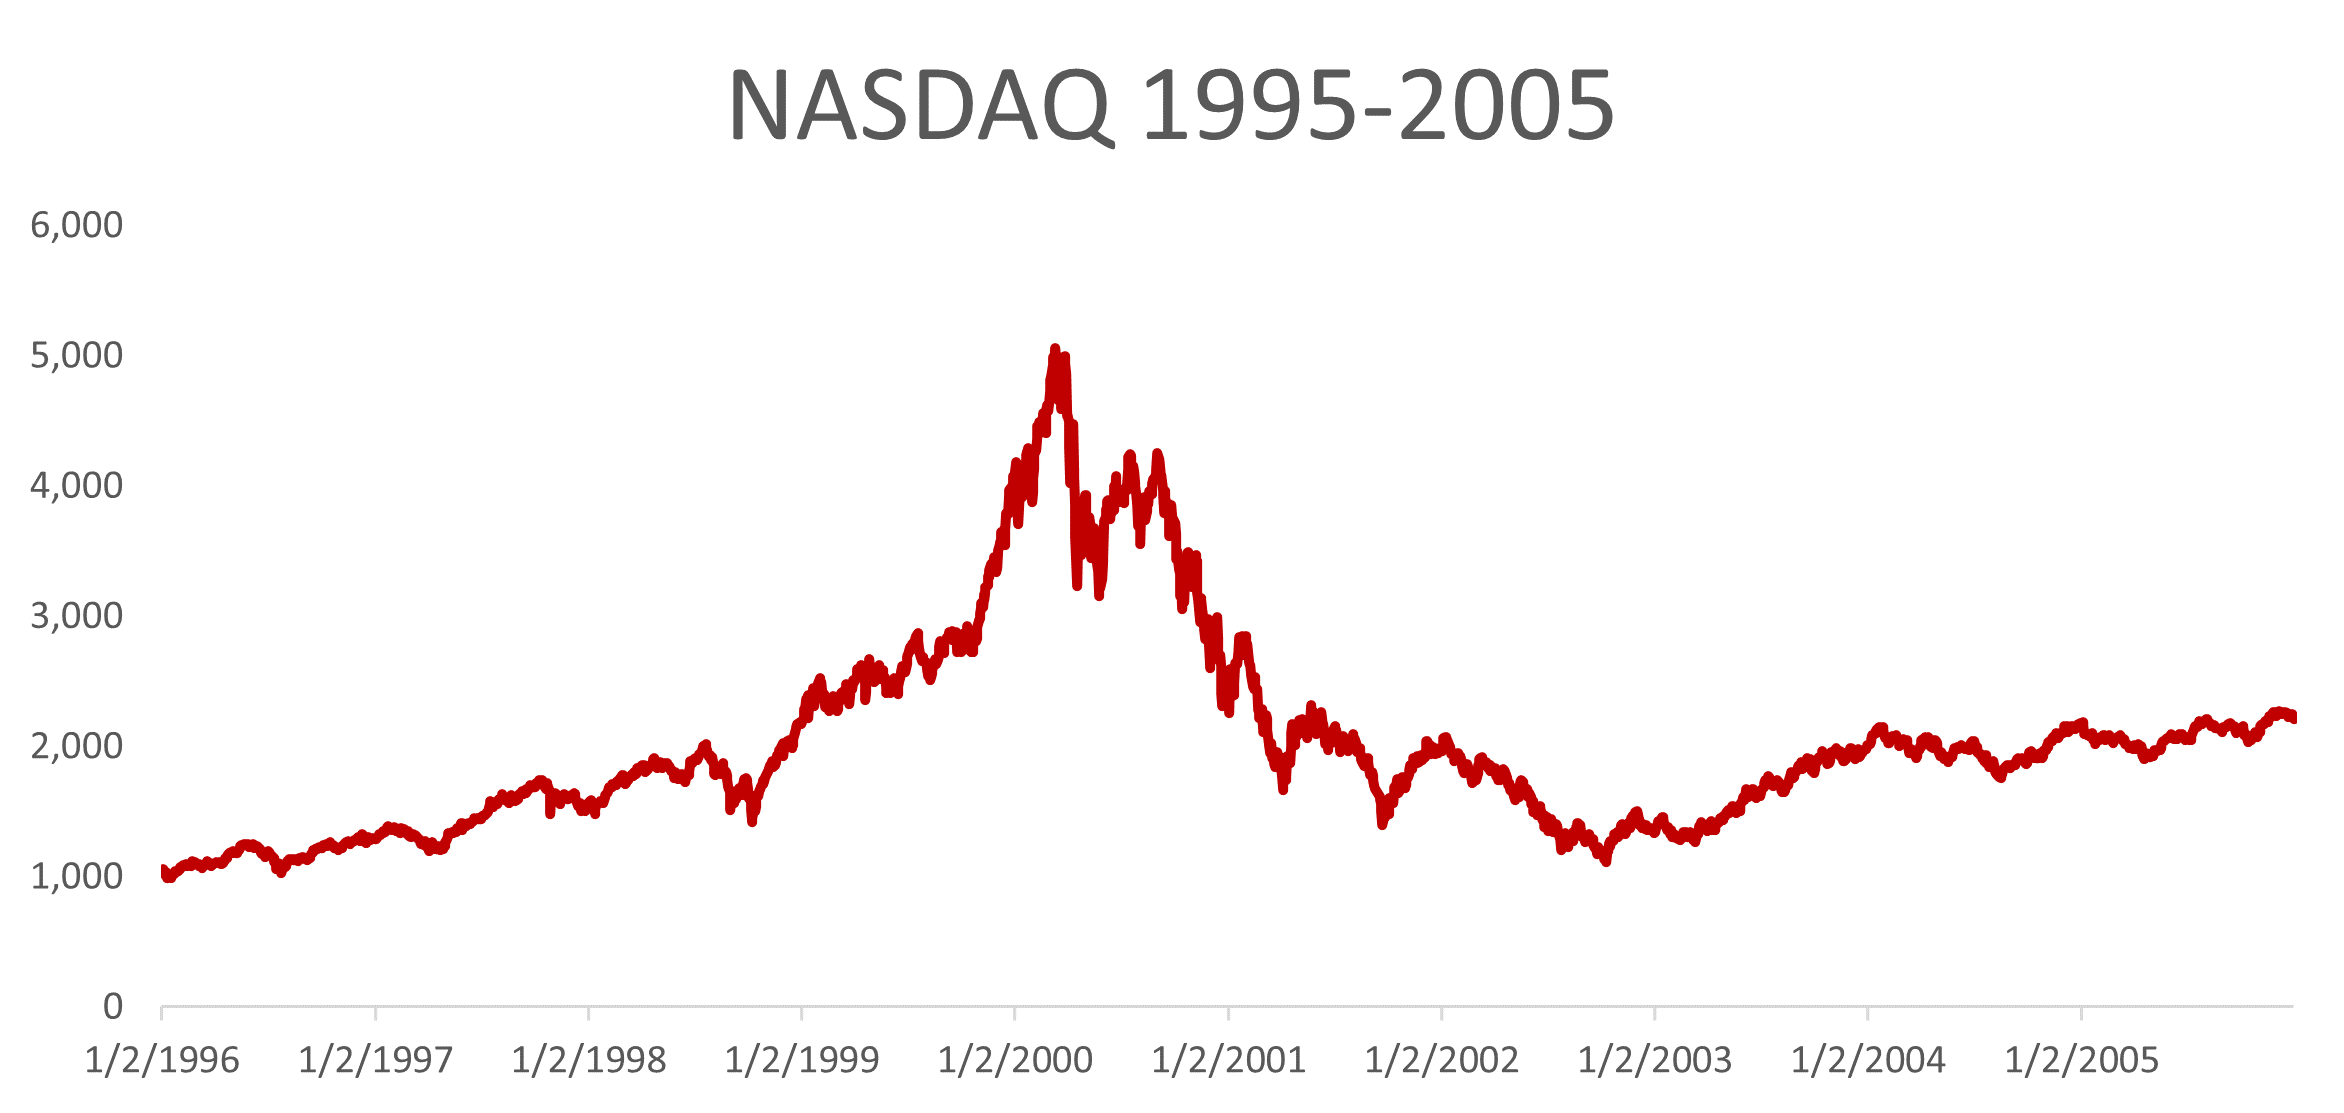
The euphoria of the 1990s DotCom boom resembles the crypto boom of 2017. A lot of Internet companies were going public with nothing more than vague business plans and a web domain. The NASDAQ peaked at 5,060 before tumbling 78% to 1,116—not as bad as Bitcoin but not by much! The crash of 2000 put into question whether these web companies would ever be worth anything at all. Did the Internet herald a new economic future, or would Paul Krugman be proven right that the Internet had the same economic potential as the fax machine?4
Source: Yahoo Finance.
It might be hard to remember now, but long before Hacker News became an insufferable echo chamber and before Y-Combinator transformed itself into a hotbed of derivative “software-as-a-service” startups, moving to Silicon Valley was contrarian! Specially in the mid-2000s, finance and consulting remained the default career paths for ambitious, if unimaginative, college graduates. Back then, if my university recollections serve me right, it was impressive to get a job offer from Google. Now, FAANG has replaced Wall Street and Harvard MBA students are busy launching NFTs.
Source: Yahoo Finance.
The mid-2000s were a liminal moment when DotCom was dead but Big Tech had yet to be born. DeFi’s liminal moment might well have been the two years between the 2018 crash and the 2020 COVID boom. Much as with the DotCom bubble, 2016-2018 saw hundreds of initial coin offerings (ICOs) created by teams with nothing more than a whitepaper. Path-independent curves, on which all DeFi is built, had yet to be discovered.5 Almost everything on offer in 2017 was, basically, a copy of Bitcoin or Ethereum. And with smart contracts capable only of minting new tokens, Ethereum was plausibly just a shiny copy of Bitcoin!
This, of course, changed rapidly. Today we have on-chain markets, margin lending, options, automated investment strategies, and more. Today’s DeFi tokens are not just shinier deflationary assets, they are part and parcel of technological approach to finance far more radical than what “fintech” companies today are attempting.
Source: Authors's calculations.
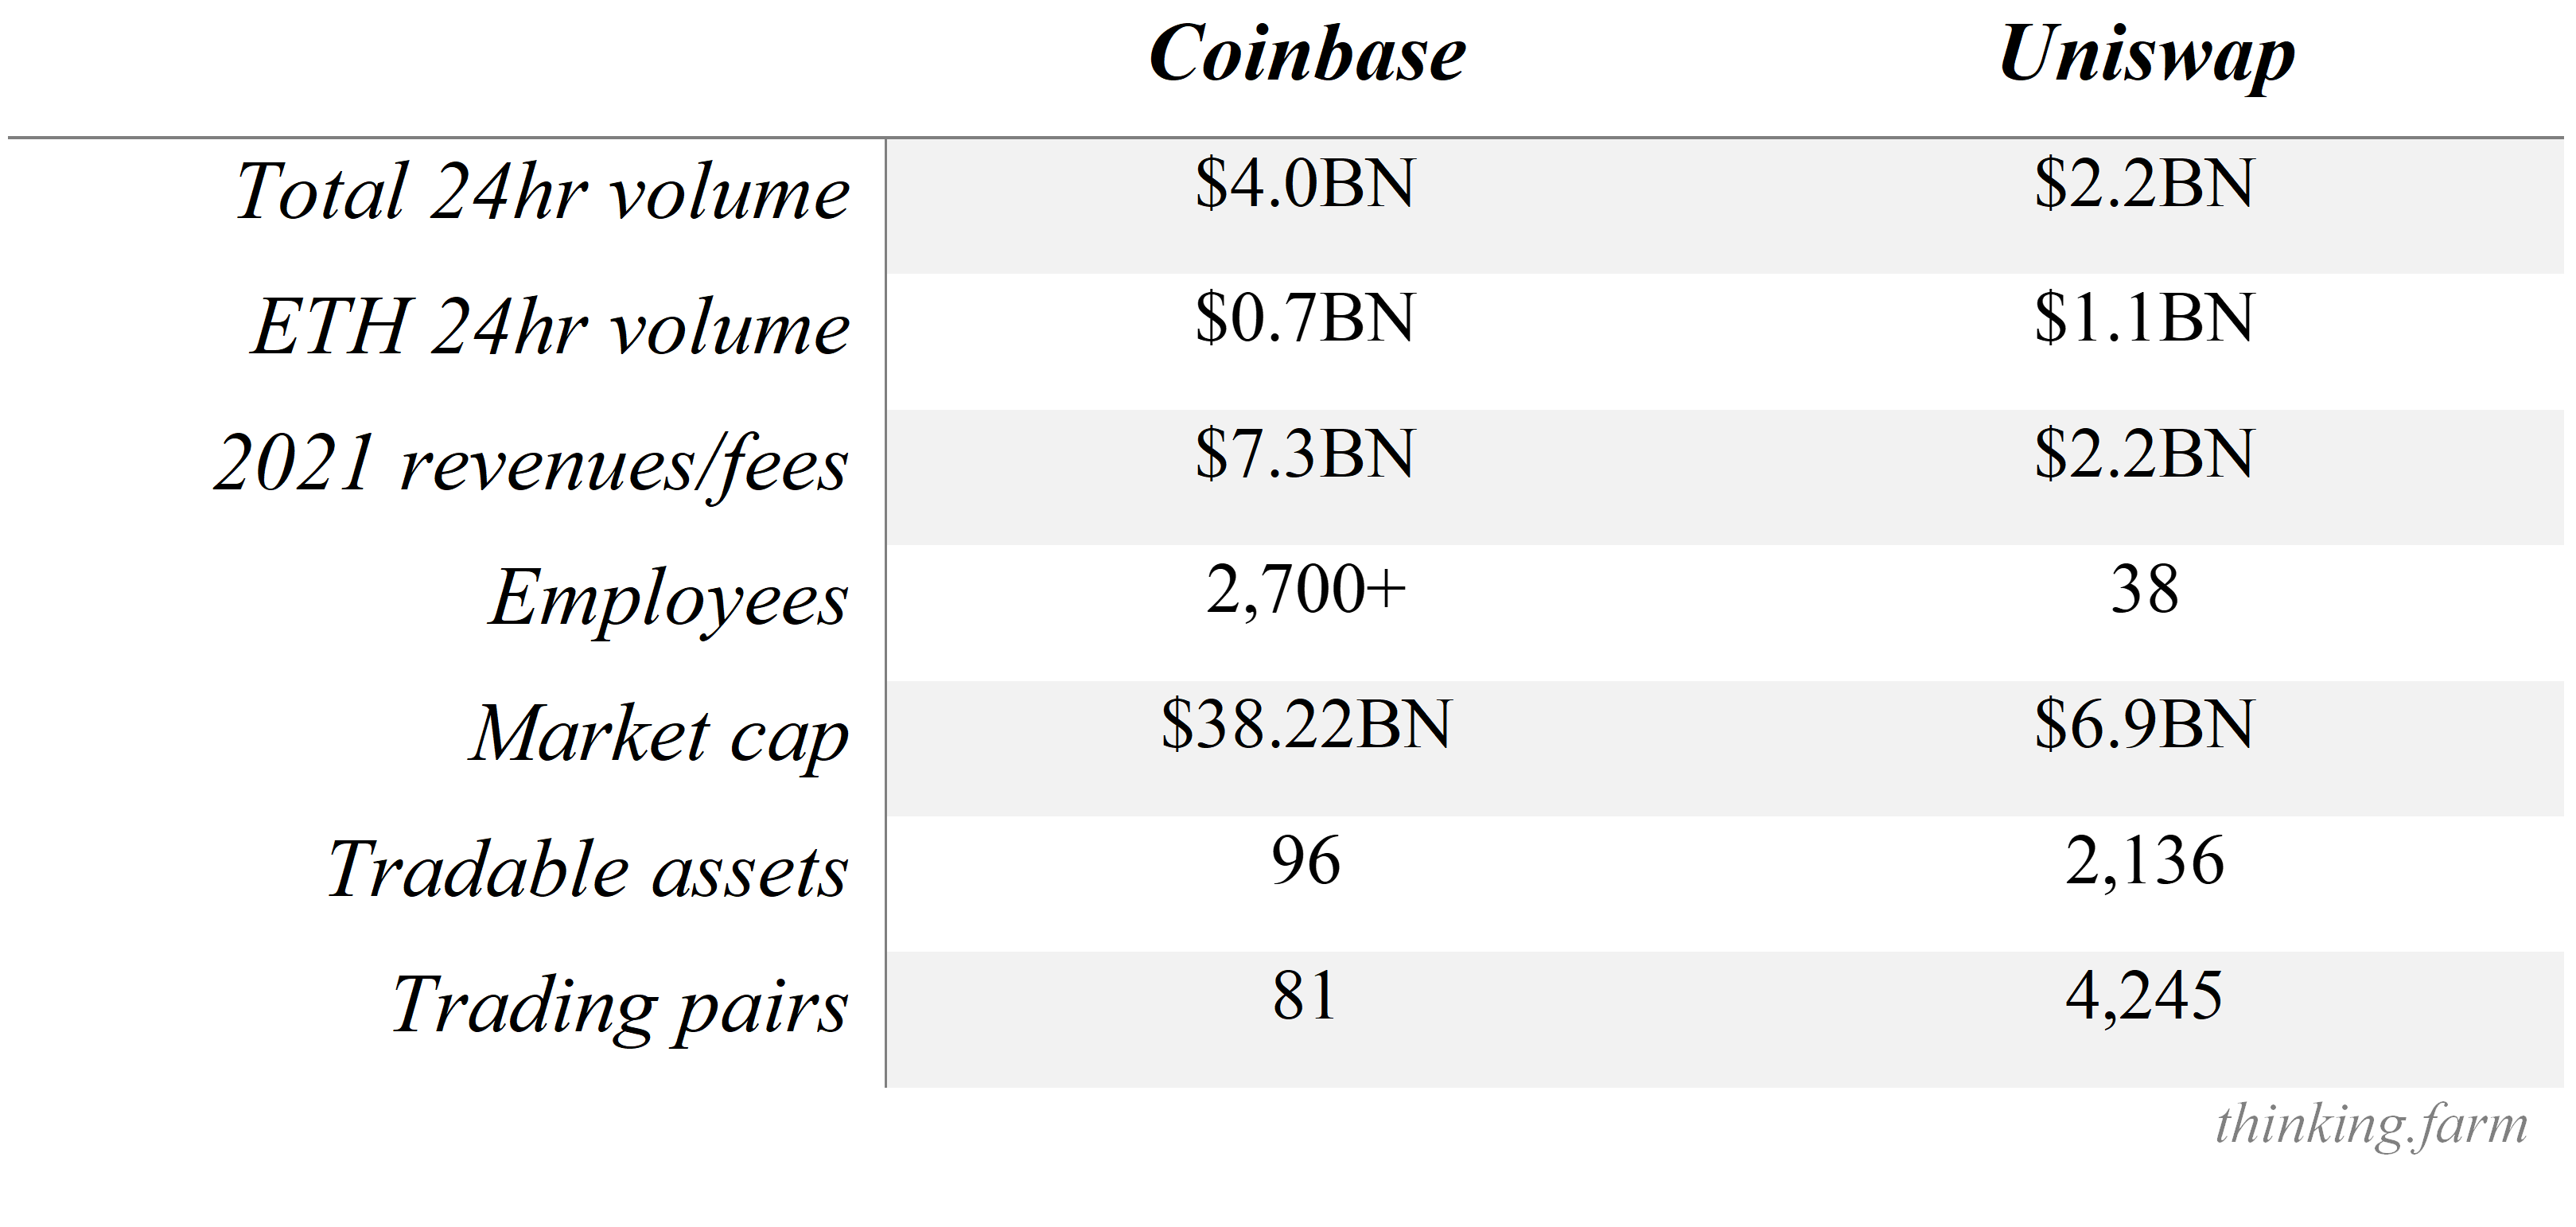
I don’t think most observers realize just how powerful these technologies are. Coinbase is the largest crypto exchange in the US, and had $4 billion in volume the last 24 hrs. Uniswap, the largest on-chain Ethereum exchange, had around $2.2 billion in volume. If we look just at ETH volume, since one can only swap Ethereum assets on Uniswap, Coinbase did $0.7 billion in volume and Uniswap $1.1 billion.6 The catch? Coinbase has 2,700 employees to Uniswap’s 38.7
More importantly, the economics of Uniswap look as disruptive to centralized exchanges as Facebook and Google were to traditional advertisers. Uniswap fees, which totalled $2.2BN in 2021, do not accrue to the protocol or its team, but to the liquidity providers that help make its markets. In contrast, Coinbase’s 2021 revenues of $7.3BN accrue to the company itself. In other words, Uniswap returns much of its economic surplus back to its users. Most other DeFi protocols work in this way, and this will allow them to be economically, though not yet regulatorily, competitive with traditional financial intermediaries. Uniswap governance token holders could choose to take a 0.05% protocol fee on volume, which in 2021 would have amounted to only $365MN.8
The parellels with the web2 platforms extends to the assets on DEXs themselves. Uniswap’s permissionless nature means anyone can list a token. It currently supports 2,136 tokens listed and 4,245 trading pairs across v2 and v3, compared to 96 tokens for Coinbase and 81 trading pairs. Coinbase curates tokens much like how traditional media curated what content could be published, while Uniswap is closer to social media platforms, where the attraction is user-generated content.9
So, perhaps 2022 will be for DeFi what 2008 was for tech stocks—a time to buy at a discount. We are past the liminal moment.
Conclusion
Bitcoin and other stores of value provide a refuge from central bank currency mismanagement. Ethereum and other smart contract platforms offer a way to bypass rent-extracting financial intermediaries. In their own way, each is an attempt to exit the ever larger regulatory apparatus that emerged after the Bank of England and other central banks began acting as national lenders of last resort.
Paul Volcker. Source: Chick Harrity, AP.
Much like Paul Volcker 40 years ago, Jerome Powell will attempt to slay the inflationary dragon. Whether he succeeds or not will hinge on how political independent the Federal Reserve remains, and the electoral calculations of the Biden administration. What’s the weaker poison–falling asset prices or high inflation?
Crypto assets surged during the pandemic given their unmatched price elasticity. The downside is that higher rates will unwind crypto prices much as the original Volcker Shock did for gold. But not all of crypto will forever trade like digital gold–even if that remains Bitcoin’s primary use case. DeFi protocols continue to gain traction and resemble mid-2000s Internet stocks more than inflation hedges. In the short term all crypto assets will trade like Bitcoin, but I would not be surprised if in a year or two DeFi begins to de-couple from Bitcoin.
Paul Volcker. “Volcker at the Fed: “Slaying the Inflationary Dragon”", Public Broadcasting Service. Interview conducted September 26, 2000. URL↩︎
Scott Horsley. “What The Rise And Fall Of Lumber Prices Tell Us About The Pandemic Economy.” National Public Radio. July 8, 2021. URL↩︎
Consider the discussions after the 2008 crisis when economists such as Larry Summers publicly wondered about the causes of “secular stagnation.” Lawrence H. Summers. “Accepting the Reality of Secular Stagnation.” Finance & Development, March 2020, Vol. 57, No. 1. URL↩︎
Paul Krugman. “Why Most Economists’ Predictions Are Wrong.” The Red Herring. 10 June 1998. ↩︎
As I’ll explain in an upcoming post, path-independent curves are a way to overcome the blockchain’s information latency relative to the outside world. ↩︎
For Coinbase employee numbers, see on January 30,2022, “About Coinbase,” https://www.coinbase.com/about; Tim Fries. “With 33x Fewer Employees, Uniswap Has 77% of Coinbase’s Trading Volume.” The Tokenist. July 6, 2021. ↩︎
Coinbase’s 2021 revenues are an average of analyst predictions, as of January 30, 2022, according to Bloomberg terminal. Uniswap 2021 fees calculate as total volume for 2021 multiplied by the most common fee rate across pools of 0.03%. Uniswap volumes from Coingecko. ↩︎
Uniswap numbers found on Uniswap.org dashboard. As of January 30, 2022, v2 had 1,687 tokens and 3,153 pairs, and v3 had 449 tokens and 1,092 pairs. Coinbase asset numbers from Coinbase Pro. Coinbase trading pairs from NerdWallet. ↩︎